With intuitive, powerful tools and data coverage for more than 40,000 mutual funds and ETFs, YCharts enables internal and external wholesalers, plus product and portfolio teams, to develop strategies and expertly demonstrate their funds’ value to advisor partners.
Firms such as John Hancock and Thornburg Investment Management have incorporated YCharts into their sales processes because it provides time savings, dynamic functionality, and strategy sharing across teams.
To demonstrate the value that the platform adds to mutual fund companies, we’ve outlined four of the top ways wholesalers are using YCharts to understand their competition, set apart their funds and strategies, and increase assets under management.
1. The YCharts Fund Flows Report
The Fund Flows Report gives an overview of where the market is trending in just a few pages and adds insight to your conversations with prospects and clients.
Distributed monthly, the Fund Flows Report breaks down which fund categories have seen the biggest inflows and outflows over the last month and other historical periods. The report then digs deeper into which individual mutual funds and ETFs within each category have received or lost the most assets.
Additionally, the Fund Flows Report provides return information for those categories and individual funds, broad market returns, and an economic outlook.
2. Prepping for Advisor Meetings
The YCharts Dashboard is completely customizable with fund Watchlists, data, and charts. To continually monitor your funds and those of your competitors, create a separate Watchlist for each fund category, adding your fund and its peers in that category. Easily compare funds on expense ratio, assets under management, and fund flows, or customize the view to include any of the 400+ fund metrics available on YCharts.
Shown below, the sortable Data tab quickly compares similar large growth funds on expenses, flows, and performance. The Fidelity® Contrafund® (FCNTX) has year-to-date outflows of nearly $6.4 billion, while the Vanguard Growth Index Admiral (VIGAX) saw almost $2.6 billion of inflows — a helpful piece of information for your next advisor meeting.
When a competitor’s fund is seeing large net outflows, it’s the perfect time to meet with advisors using that fund to pitch your own comparable funds as an alternative. The YCharts Fund Screener makes it quick and easy to identify funds that are losing assets.
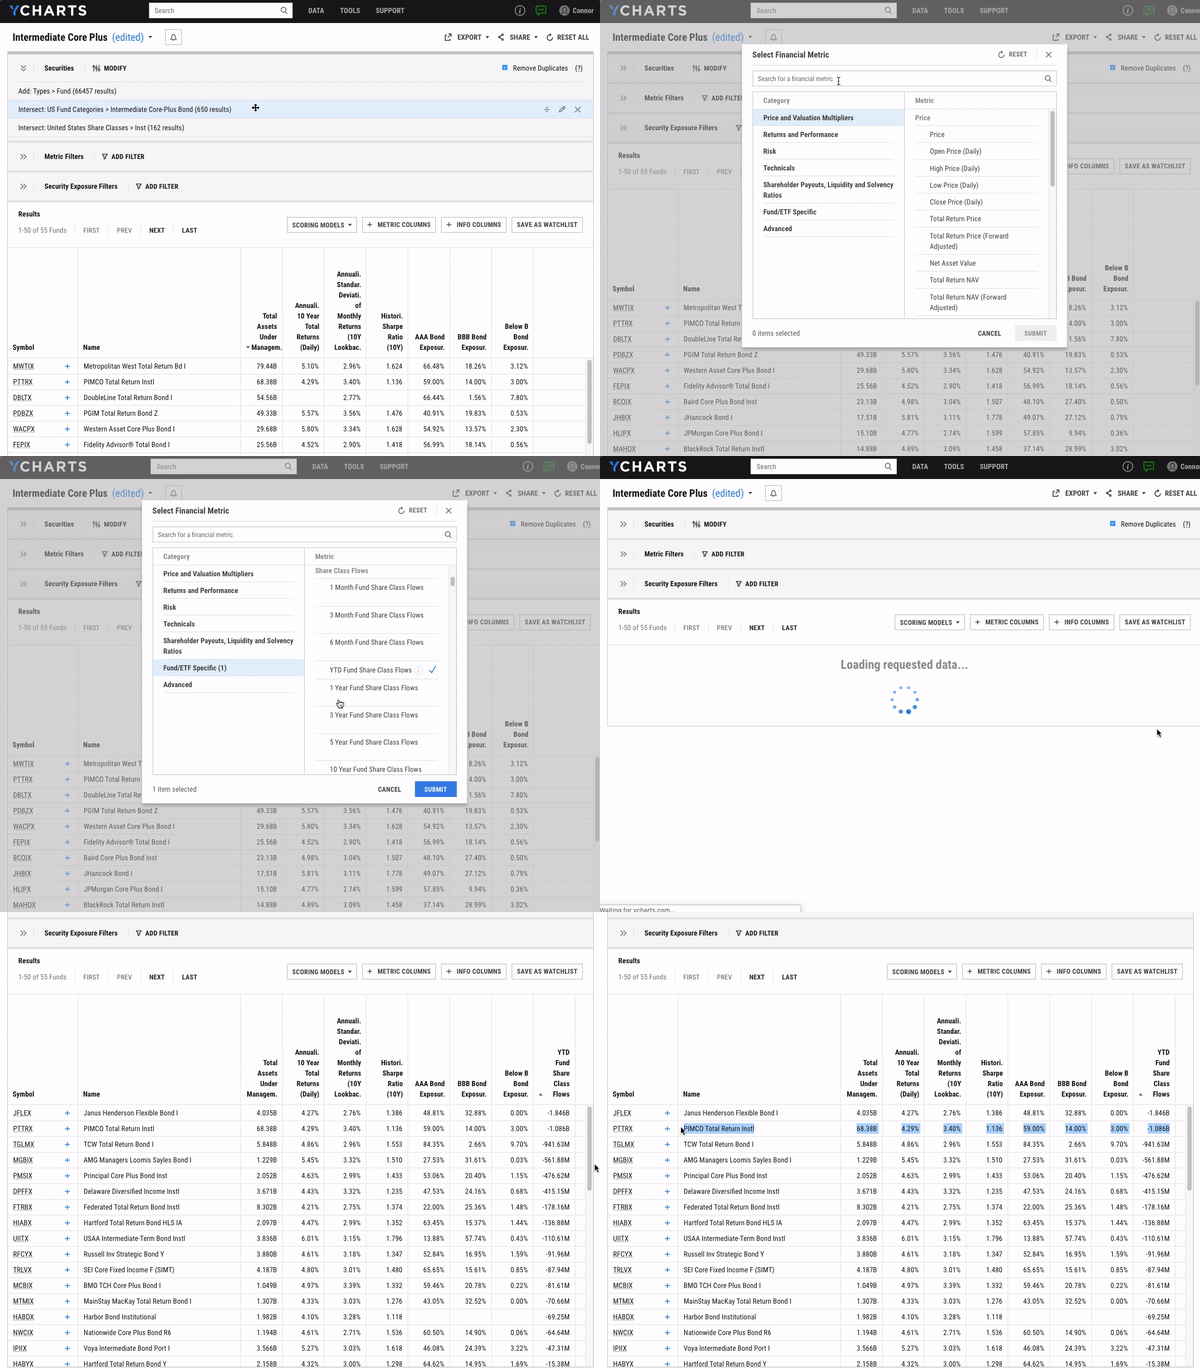
Shown below are the largest intermediate core-plus bond funds with metrics including historical returns, standard deviation, Sharpe ratio, and credit quality exposures for each fund. Click “Add Metric Column,” type ‘fund flows’ and YCharts’ predictive search will auto-fill several duration options.
Sort the year-to-date fund flows column from least to greatest to find funds with the most outflows. After identifying a competing fund with large outflows, schedule time with advisors you know are using that fund and strike while the iron is hot.
3. Visualization during Advisor Meetings
When meeting with advisors, using data and visuals from a third-party site like YCharts helps establish trust. Instead of marketing materials produced by their respective fund company, wholesalers use YCharts to objectively compare managers and strategies from different firms.
Using Fundamental Charts, visually compare your fund to competitors’ in a dynamic and intuitive format.
The example below shows how a few similar funds (DFAPX, JHCDX, and VBTLX) performed during a rising interest rate environment and includes the 10 Year Treasury Rate (in green) to explain the funds’ performance. Next, dig deeper by looking at each fund’s performance (purple) and its standard deviation (orange), or add and other fund metrics on which you’d like to compare.
To paint a more data-oriented picture, Comp Tables allows wholesalers to pick the exact metrics to use when comparing their funds and others. This level of customization enhances conversations with advisors by letting wholesalers control the narrative and present their funds in the context of a given strategy.
Below is a Comp Tables view of several high yield bond funds’ asset allocations and credit quality exposures. Comparing and contrasting the data, side-by-side, for each fund allows wholesalers to highlight vivid distinctions between their funds and others, such as how the Vanguard High-Yield Corporate Fund (VWEAX) below has a 2.8% exposure to non-rated bonds, and the peer group’s average is 1.7%.
4. Post-Meeting Communications
Wholesalers know the importance of staying top-of-mind after leaving an advisor meeting. If too much time passes without contact, it’s hard to rekindle productive conversations.
Soon after leaving an advisor’s office, mutual fund representatives can use YCharts’ Model Portfolios to solidify the value that their funds can add to an advisor’s existing portfolio offerings.
Using an advisor’s asset matrix, create and save a Model Portfolio in YCharts. Holdings for an example portfolio are shown below:
In this example, assume you identified the JPMorgan US Research Enhanced Equity (JDEUX) fund as one you can replace. Rotate out JDEUX and replace it with the Hartford Core Equity (HGIIX) fund, for example.
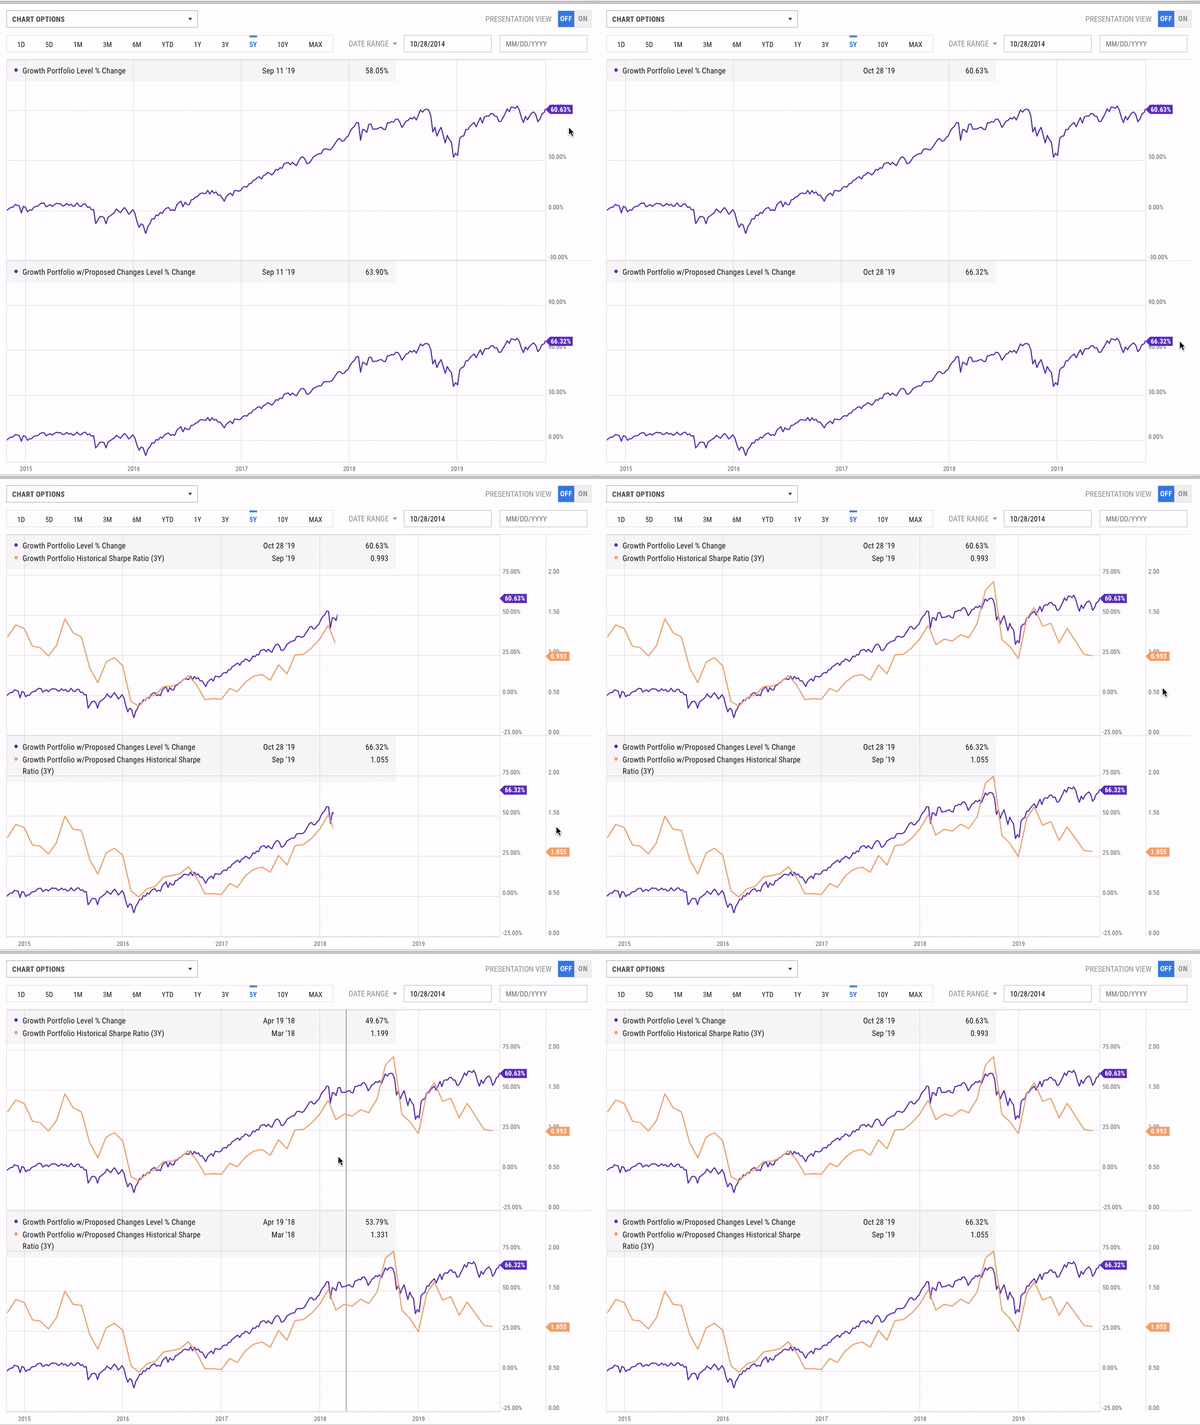
Finally, view any portfolio-level matrix for both strategies to show how your funds can help boost returns or limit volatility, exposure, or drawdowns. Below, the example Growth Portfolio (top) and the same portfolio with HGIIX replacing JDEUX, called Growth Portfolio w/Proposed Changes, are shown. Swapping out the funds added an additional six points of total return and improved the portfolio’s Sharpe Ratio.

In summary, YCharts improves the way mutual fund wholesalers interact with advisors by enabling dynamic sales conversations, additional touch points, and more data-driven sales strategies.
The features and functionality described in this blog only scratch the surface of how YCharts helps mutual fund representatives stay informed of the market, prepare for meetings more efficiently, share strategies across teams, and increase their AUM.
Want to see how YCharts can help your team have better, more productive meetings with advisors? Schedule time with a YCharts asset management expert or call (866) 965-7552 to speak to a team member.


