CASE STUDY

Meet Barring Coughlin, President & Chief Investment Officer at Coughlin Associates

About
Coughlin Associates is a national investment research firm that manages money for individuals and provides research-outsourcing services for registered investment advisors. Managing under $50 million in assets, the firm was founded by Barring Coughlin, an investing veteran with more than 30 years of investment management and research experience at prominent money management firms, including NationsBank and Bank of America.
The Challenge
Barring Coughlin, President and Chief Investment Officer at Coughlin Associates, was struggling through hours of manually entering data into Excel for the quantitative model that is at the core of the firm’s strategy. To address some inherent shortcomings from their current research tool, Value Line, Barring was seeking opportunities to automate elements of his investment research process.
While Value Line provided Barring with the ability to do much of the initial filtering necessary to find securities that met his criteria, subsequently, he still needed to adjust each company’s quarterly earnings report in his spreadsheet to run his calculations and evaluate particular investment opportunities.
“I found myself spending a third of my day, each day, simply entering data into Excel,” said Barring. “Earnings season was especially challenging, as I didn’t have tools that could help me gather insights about which companies had positive changes in earnings and momentum.”
![]()
YCharts took my algorithms and enabled me to work more efficiently. Now I can run my spreadsheets and know what companies I want to further analyze within 5 minutes. That process used to take me hours.
The Solution
In early 2015, Barring was ready for a change. After learning that he could save several hours each day with the YCharts’ Excel Add-in that automatically downloads data into his models, he was sold on YCharts. Barring was up and running on the platform in about a month, using custom built solutions from YCharts to meet his complex data needs.
“I didn’t want to learn more programming and I didn’t want to hire staff to do it,” Barring said. “YCharts took my algorithms and enabled me to work more efficiently. Now I can run my spreadsheet and know what companies I want to further analyze within 5 minutes. That process used to take me hours.”
Prior to YCharts, Barring also spent a lot of time researching ETFs and regularly needed accurate fundamental data. Knowing that ETFs were becoming increasingly popular, Barring found that YCharts’ deep data sets would enable him to make smarter investing decisions.
"Barring automated an Excel model that would give him summary financial statistics on ETF holdings, such as historic growth rates and time-series fundamental data
“When I realized I had to use ETFs to expand my reach, I had to make a fundamental case to buy a specific ETF,” Barring said. “To solve that problem, I created a basic model to help me assess the fundamentals of the underlying companies of any U.S. ETF. The charting tool with time-series data allows me to look at the important financial variables over a period of time.”
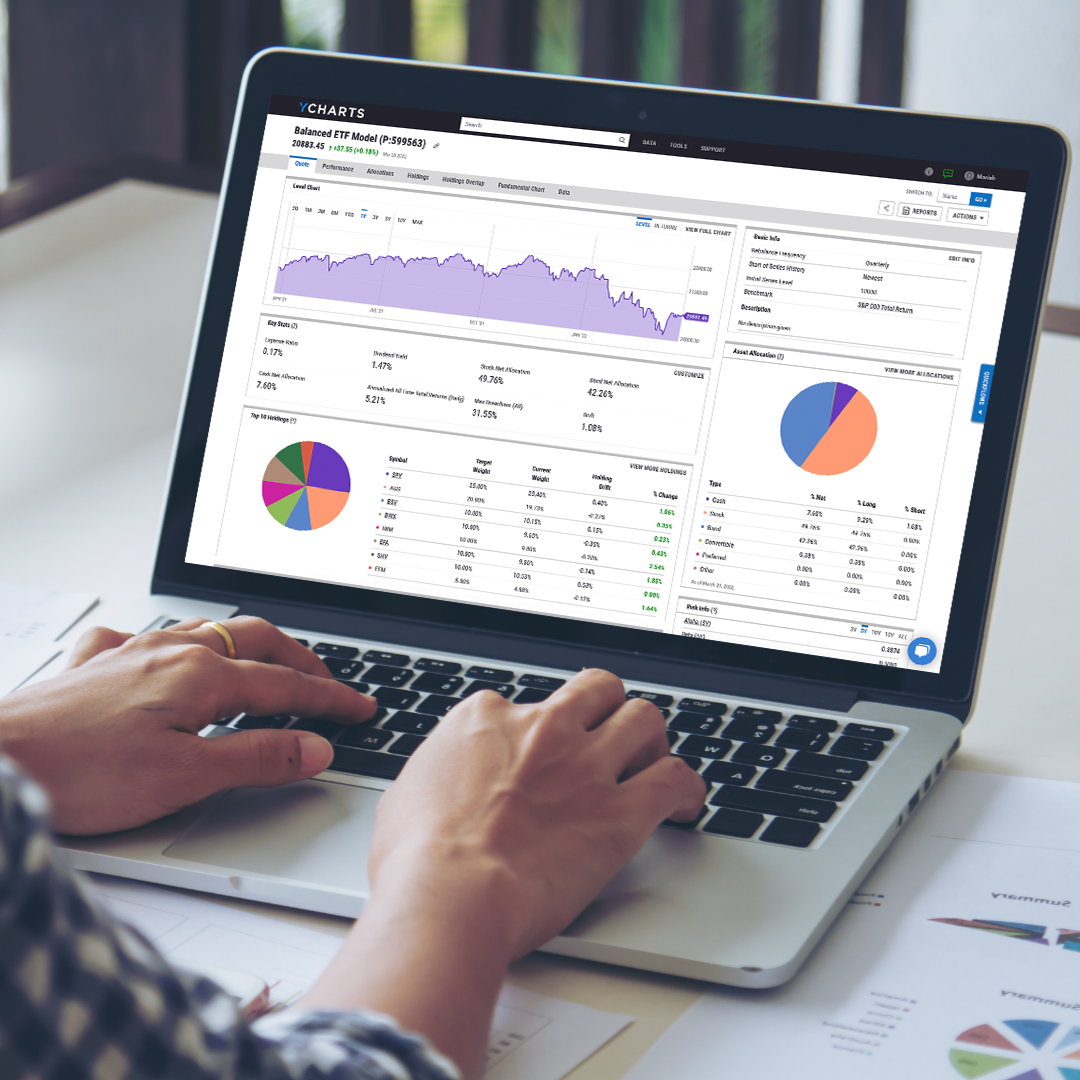
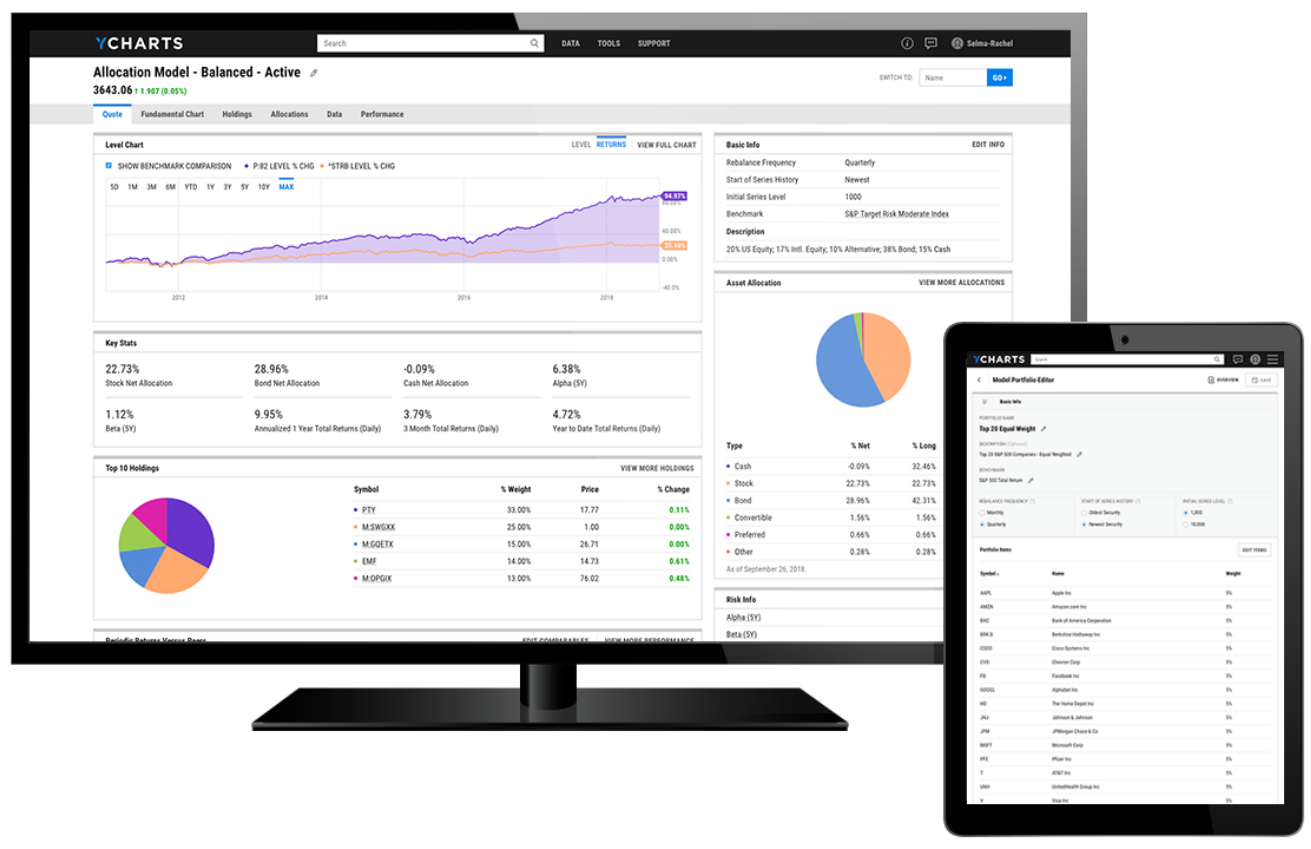
To continue to monitor the performance of selected ETFs, Barring uses YCharts’ application to track securities. “The YCharts dashboard is my quote machine,” he added.
![]()
The analytical tool with time-series data allows me to look at the important financial variables over a period of time. The YCharts dashboard is my quote machine.
The Results
As a sole proprietor running a lean organization, Barring continues to make a concerted effort to keep any non-productive, fixed costs out of his business model. As such, YCharts is a mainstay because the platform saves him from making mistakes and yields higher investment returns.
“I would not be using YCharts if I did not feel that the data provided me with the resources I need to make better decisions,” Barring said. “My clients care about getting results and seeing that I’m spending time taking care of their assets.”
Barring knows that the biggest cost to an advisor is time, and, with YCharts helping him free up administrative time, he can focus his day on more value-adding efforts, like growing his practice. Every new model he uses in his investment process is designed to enhance research quality and, ultimately, save him time.
“I am happy with YCharts because it provides all the data I need for my financial analysis, while requiring significantly less time than I’ve ever spent before on data analysis and gathering,” Barring added.
![]()
I am happy with YCharts because it provides all the data I need for my financial analysis, while requiring significantly less time than I’ve ever spent before on data analysis and gathering.
Tools Used

Success Made With YCharts
The YCharts Excel Add-in makes manual data entry a thing of the past and frees up Barring Coughlin to spend his time making smarter investments and providing outstanding client service.


