.png?width=950&name=Integrated%20+%20YCharts%20(default).png)
Integrated Financial Grows Managed Portfolio Assets from $700M to $1.3B, Uses YCharts to Optimize & Monitor Strategies

About
Dr. Rob Brown has over three decades of experience building portfolios. In that time, he has worked in many facets of the wealth management industry, including corporate and public pensions, hedge funds, consulting to endowments, and investment education. Since 2017, he has led the conception, design and delivery of Integrated Partners’ various enterprise-wide investment solutions as Chief Investment Officer. Additionally, Dr. Brown oversees the firm’s portfolio management from initial construction to continued performance monitoring. He takes a consultative and educational approach with each advisor he works with, making sure to be a teacher first and foremost.
The Challenge
Integrated works with over a hundred financial advisors across 40 regional offices and needed an all-in-one solution for portfolios—with remote access capabilities. The ideal tool would help the central office build out model portfolios for different investment strategies and share them with their advisors in the field. To enable advisors to present Integrated’s strategies to clients, a user-friendly solution for portfolio comparisons and sales collateral was also a must. Integrated wanted a platform that would simplify client communication for their advisors.
We needed an easy-to-use tool to monitor performance, risk, and composition - but would next effectively communicate and build awareness with our advisors,” per Dr. Brown.
The firm had previously used other tools for the same mission, but found that they were not as intuitive for advisors to use and faced instances where data was inaccurate or improperly categorized.
![]()
We needed an easy-to-use tool to monitor performance, risk, and composition - but would next effectively communicate and build awareness with our advisors.
The Solution
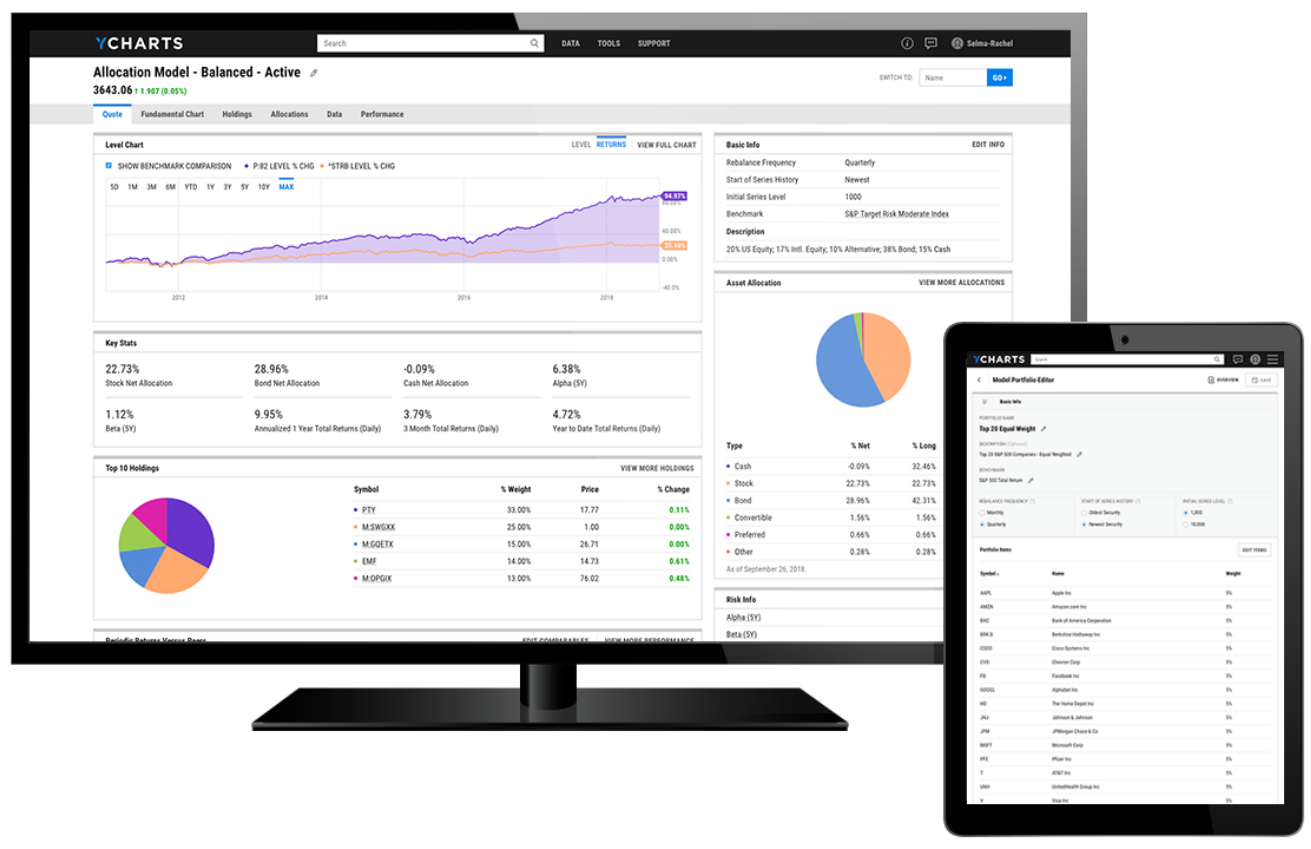
“Once Integrated Partners began using YCharts as a part of its daily operations, there was no turning back,” noted Dr. Brown. YCharts made constructing model portfolios easier, and it allowed for straightforward navigation by advisors in the field.
Dr. Brown explained that “YCharts provided our team with live data that was more accurate when monitoring portfolio performance. Not only that, but YCharts further separated itself from the competition with its dynamic portfolio allocation features and provided for a more accurate representation of performance through historical allocation changes.”
YCharts proved to be a valuable tool for Integrated by streamlining communication between Dr. Brown’s central team and their partner advisors. Not only that, but advisors were finally able to share clean and compelling visuals via customizable PDF reports. Integrated’s advisors have told Dr. Brown that without YCharts, they're not sure how anyone could stay up-to-date and present models to clients.
“There was an enhanced level of simplicity and emphasis on visuals within YCharts,” said Dr. Brown. Adding that the “ease of use was mind- blowingly wonderful!”
![]()
There was an enhanced level of simplicity and emphasis on visuals within YCharts,” said Dr. Brown. Adding that the “ease of use was mind-blowingly wonderful!
The Results
Dr. Brown uses YCharts to manage 61 model portfolios, based on a range of asset allocation and tactical strategies, for the firm’s advisor partners. The intuitive nature of the YCharts platform not only makes building portfolios more seamless, but also gives advisors at-will access to every portfolio strategy in one portal, adding efficiencies to Integrated’s role as a partner and investment manager.
Additionally, Integrated Partners finds value in using the YCharts Stock Screener and Dashboard features for idea generation and portfolio monitoring. With the Stock Screener, Dr. Brown identifies equities that meet his criteria for inclusion in a stock-centric portfolio strategy. YCharts’ data allows him to make the most informed decisions in near real-time on behalf of his advisors. To monitor Integrated’s expansive portfolio offerings, Dr. Brown tracks their live performance and key metrics such as yield and expense ratio using the Dashboard.
Since implementing YCharts, Integrated has grown assets in their managed portfolios from $700 million to roughly $1.3 billion. The combination of portfolio management features leveraged by Dr. Brown’s team and on-demand, client-facing reports used in the field have allowed advisors to spend more time building new and existing client relationships. Using YCharts, Dr. Brown and his team continue to provide advisors the freedom and flexibility they need to grow their practices and achieve their entrepreneurial aspirations.
“YCharts has the potential to be a tool that lives within every advisor’s computer that, in essence, provides them a real-time portal into Integrated’s portfolios,” says Dr. Brown.
He continues to encourage Integrated’s advisor partners to use the platform to explore the firm’s managed portfolios and better communicate investment options to their clients.
![]()
YCharts has the potential to be a tool that lives within every advisor’s computer that, in essence, provides them a real-time portal into Integrated’s portfolios.

Success Made With YCharts
Dr. Rob Brown, PhD, CFA, Chief Investment Officer of Integrated Partners, relies on YCharts to grow assets in managed portfolios, communicate with advisors in the field, and disseminate helpful sales and communication collateral.


