CASE STUDY

Caleb Silver Uses YCharts for Next-Level Data & Visually Compelling Charts to Create Educational Content

Caleb Silver
About

Investopedia is a staple in the investing and financial media landscape. Serving investors since 1999, the website features more than 30,000 articles and financial definitions, FAQs, news articles, videos and newsletters. With an audience that consists of experienced investors, business owners, professionals, financial advisors and new market participants, Investopedia strives to simplify complex financial information and empower investors to make smarter decisions with their money.

The Challenge 

Earnings announcements serve as a “report card” for public companies. They’ll often provide answers to investors’ burning questions: Is the business growing in areas where it wants and needs to grow? Is it slowing down in other business units that drive profitability? Are there new areas that management wasn’t focused on, but should be? Metrics such as Sales Growth, Profit Growth and Gross Profit Margins are discerning data points, but they only tell part of the story.

Caleb felt that Investopedia’s earnings content was “very run of the mill.” He didn’t think that their analysis was digging deep

enough into each company. With access to only a few free tools, publicly available research data and the SEC’s website, he knew he had to find a platform that provided access to higher quality data, enabled the creation of more dynamic visuals, and saved his team significant time.

"As I’m constantly looking for ways to improve our editorial for our readers, I needed to find a tool that I could not just ‘tell' investors what's going on with a given company, but also ‘show’ them,” Caleb explained.


Untitled design (16) copy
As I’m constantly looking for ways to improve our editorial for our readers, I needed to find a tool that I could not just ‘tell' investors what's going on with a given company, but also ‘show’ them.

The Solution

As an active participant in the “fintwit” (or finance Twitter) community, Caleb saw several people that he follows using YCharts’ visuals and data in their social posts, blogs and podcasts. Convinced by the significant uptake in YCharts amongst his peers, he investigated further and he activated accounts for his team to learn more about how YCharts could improve workflows at Investopedia. After digging into the tools, he was pleased to see the depth of the platform’s data and noted that it could give his readers a more informed perspective on how to evaluate a company during earnings season.

“When you’re looking at a company, a price chart simply isn’t going to cut it,” Caleb shared. “The key operational metrics that are important to individual companies are nuanced. For example, data points that are important to Netflix are very different than Apple. YCharts allows my team to quickly access those metrics.”

And with better, data driven analysis, Investopedia is finding greater success in answering reader questions. Team

-wide access to YCharts enables Investopedia’s editorial team to better communicate with readers and has increased engagement amongst its community.

“There’s nothing more rewarding than to take a reader's question, do some research on YCharts and come back to them with the insights that we found,” Caleb added.

Whenever volatility returns to the market, Investopedia uses YCharts to provide a more wellrounded analysis of company earnings during market events like the US-China trade war or the coronavirus crisis. Using the YCharts Stock Screener, Investopedia can identify which companies are most impacted and provide readers with perspectives on their operations during downturns.

“As companies report [earnings] during the throes of the coronavirus crisis, we aim to educate investors on the importance of companies being transparent about the state of their business so there are no surprises,” said Caleb.

Untitled design (16) copy
When you’re looking at a company, a price chart simply isn’t going to cut it. The key operational metrics that are important to individual companies are nuanced. For example, data points that are important to Netflix are very different than Apple. YCharts allows my team to quickly access those metrics.

The Results

With increased open rates and higher engagement on Investopedia’s “The Express” and “Market Sum” newsletters since leveraging YCharts, Caleb believes the platform has contributed significant value not only to th Investopedia team, but also to its readers.

“I feel like I can dunk now that I’m using YCharts!” Caleb joked. “Our whole team is excited now that we have the tools to dig deeper into the key operational metrics on companies.”

While the platform’s data and visuals have supercharged Investopedia’s content, Caleb’s favorite part about YCharts is the customer support. He appreciates how quickly he receives a response to his unique requests, enabling him to promptly respond to reader questions directly within Investopedia’s newsletters.

The Investopedia team also enjoys YCharts’ sharing capabilities, which allows for easy,

efficient collaboration on content ideas. “Being able to save Fundamental Charts, Stock Screens and Metric Sets and then distribute them to the team within the tool is a massive time-saver, especially during a busy earnings season,” added Caleb.

Caleb is confident that YCharts can provide value to investors of all kinds. Whether you want to generate new investment ideas, recreate strategies you see on “fintwit” or perform intensive analysis on a company, YCharts makes it easy to present insights and information in a digestible way.

“YCharts is a dynamic platform with deep  functionality,” said Caleb. “The platform is complete with several tools that will help you share smart data and smart charts that help you better communicate with your audience.”

computer croped

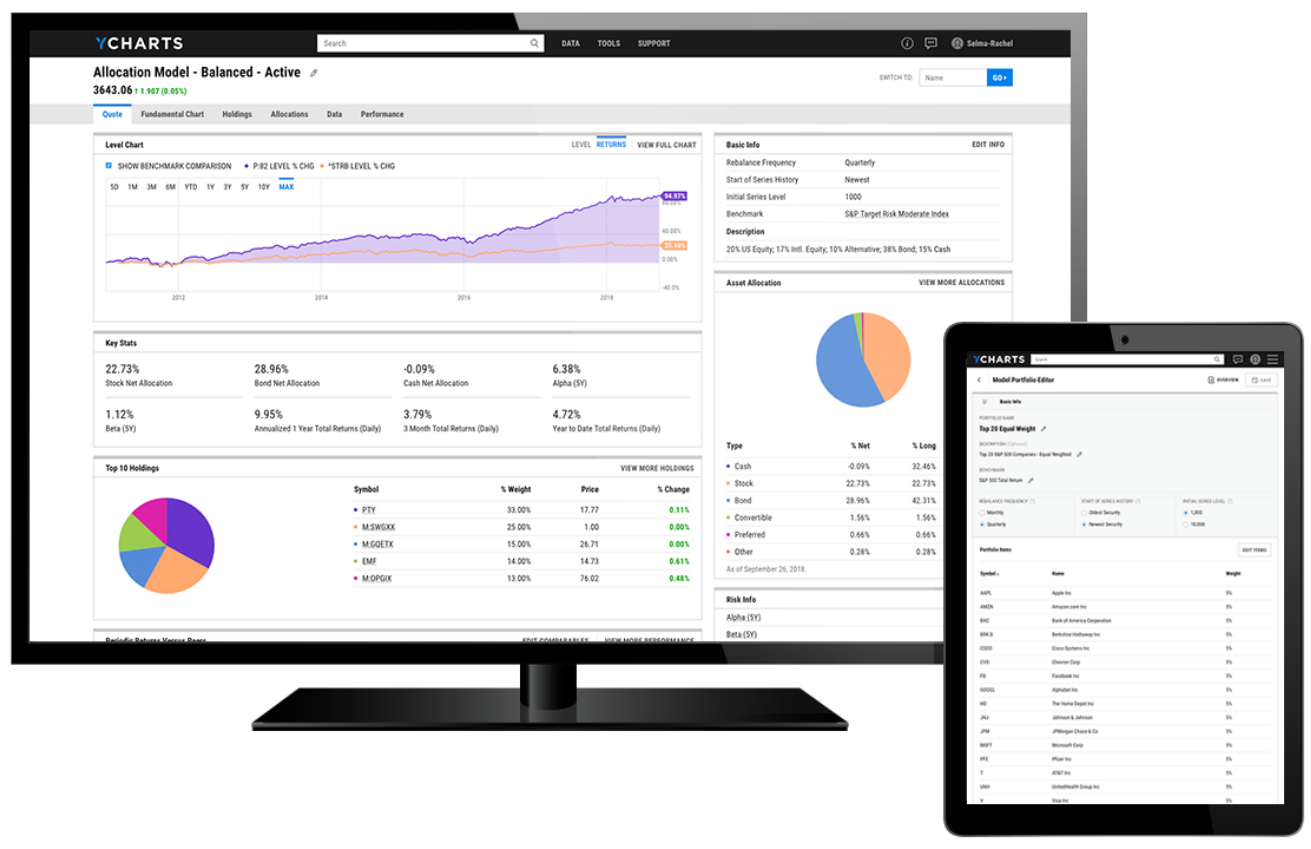
Success Made With YCharts

Leveraging YCharts for next-level data,  visually compelling charts and improved team collaboration, Investopedia can churn out dynamic, educational content to share with their millions of monthly readers.

 
Free trial buttonbook a demo button
 
 
 ]