CASE STUDY
-png.png?width=1398&height=215&name=kkm%20%20(1)-png.png)

About
As a regular contributor on CNBC’s Halftime Report, in addition to his full-time job as CEO and portfolio manager at independent investment solutions firm KKM Financial, Jeff wears many hats. Servicing clients with a proactive, risk-managed approach by utilizing dynamic stock selection, hedging, option-overlay, and ETF model portfolios, Jeff and his team at KKM focus on portfolio management and hedging solutions for wealth advisory firms, family offices, and institutions.
![]()
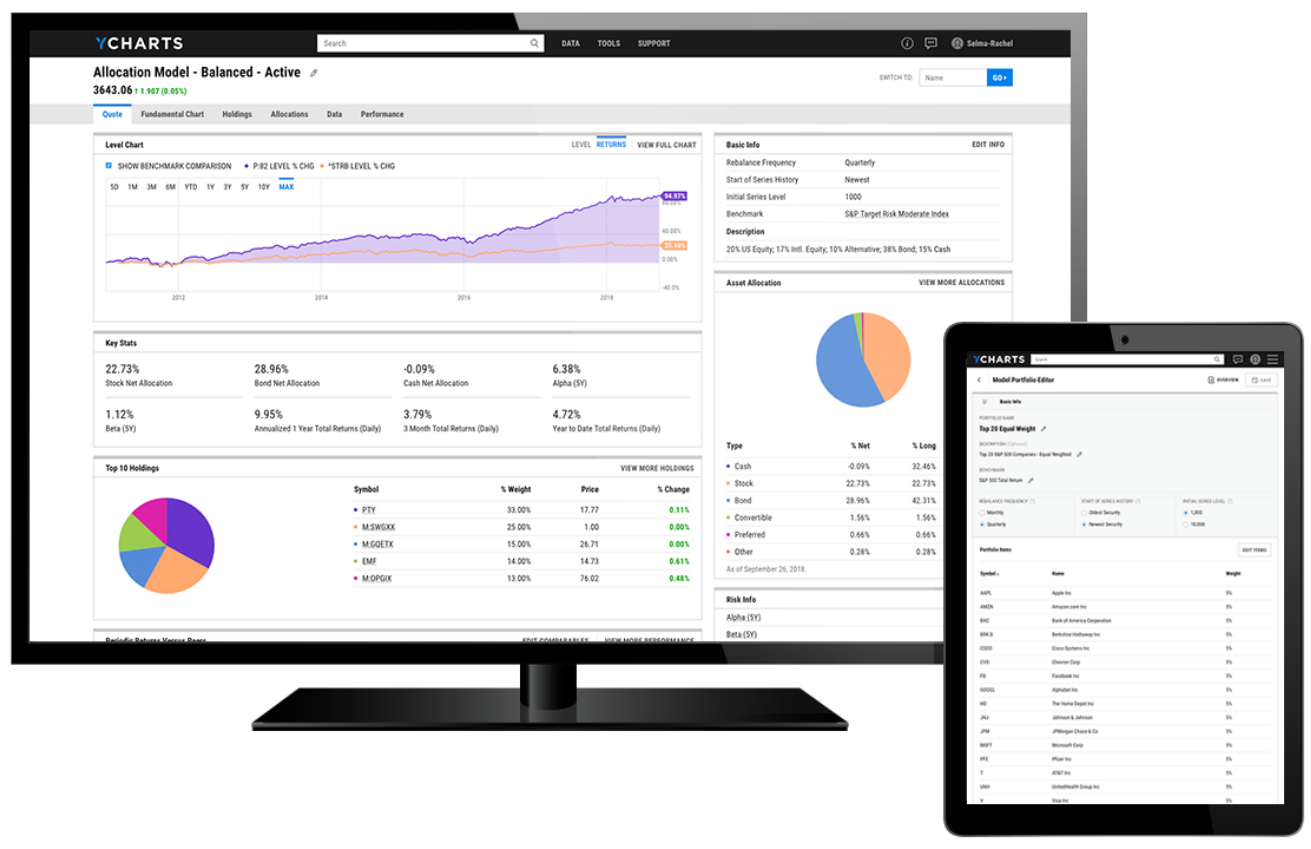
With YCharts, I’m able to quickly monitor key holdings and big movers, in addition to researching mutual funds and comparing them to sectors or single stocks.
![]()
Previously, everything was ad hoc in Excel, and it was a really slow-moving process. Now, constructing new portfolios for clients is easy, efficient, and much more manageable.
![]()
Using YCharts, we’re able to help them understand something quickly using a table, picture, or chart. Rather than trying to explain with words, which could take 20 minutes, showing data and graphics in YCharts helps them see the value in KKM’s offerings.


Success Made With YCharts
Leveraging YCharts to research investments continues to provide value for Jeff in his analysis for CNBC and has enabled his team at KKM to deliver smarter investment opportunities for clients.