The Absolute sub-tab is designed for straightforward attribution analysis. This analysis involves calculating the contribution and detraction of a portfolio or fund's holdings by multiplying their weights by their respective returns. The Absolute sub-tab presents this data in two formats, the heatmap module and the attribution table.
Absolute Attribution Heatmap
The Absolute Attribution heatmap displays three numerical values for each holding, providing insight into both the individual performance of the security and its contribution to the overall fund or portfolio’s returns. These holdings and their corresponding values update dynamically based on the selected lookback period within the heat map.
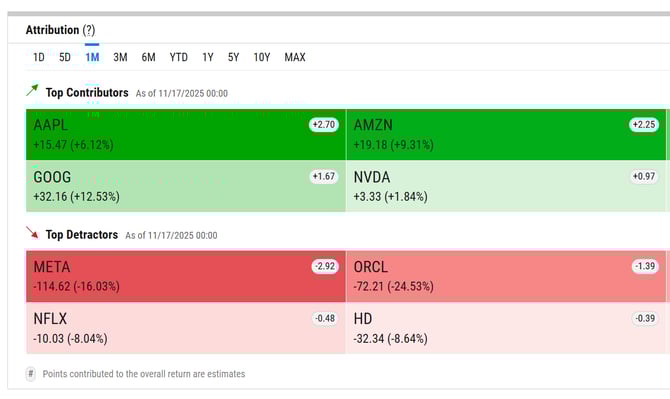
For example, when evaluating AAPL:
- The first value beneath the ticker reflects the absolute price change over the selected lookback period.
- Over the past month, AAPL's share price increased by $15.47.
- The second value represents the security’s price return for the same period.
- Over the last month, AAPL generated a 6.12% price return.
- The figure displayed within the white bubble indicates the security’s total return level contribution to the portfolio or fund.
- During this period, AAPL contributed 2.7 to the portfolio’s total return level.
Attribution Table
The table displays the contribution and detraction of all holdings over predetermined timeframes, including 1 Month, 3 Month, 6 Month, YTD, and 1 Year columns. This table displays the value each holding has contributed/detracted from the portfolio level, allowing for a more detailed examination of the holdings' impact on the portfolio's performance.
The returns in this table are calculated using the following formula: = Weight x (Return / (1 + Return))
