Each asset allocation module differs in analysis scope, with some calculating metrics across the entire portfolio, while others focus exclusively on either equity or fixed income holdings.
Asset Allocation
Region Exposure
Market Capitalization
Stock Sector Exposure
Stock Style Exposure
Bond Sector Exposure
Bond Credit Quality Exposure
Bond Maturity Exposure
Asset Allocation
Definition: Asset Allocation reflects the asset class weightings of the fund or portfolio
Coverage: Entire Investment
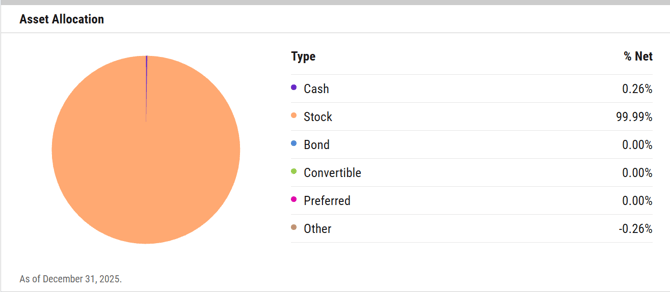
Breakdown:
- Cash: Cash and cash equivalents
- Stock: All common stocks
- Bond: All individual bonds
- Convertible: Convertible bonds, convertible floating rate notes, convertible 144a
- Preferred: Preferred stocks, preferred 144a, preferred ARPI, preferred convertibles, preferred CV PFD
- Other: Alternatives, warrants, options, crypto
Region Exposure
Definition: Reflects the exposure of a fund or portfolio's investments to the indicated geographic area(s).
Coverage: Entire Investment
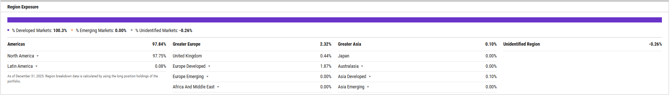
Breakdown:
- Developed: Countries who have bonds that are considered "investment grade"
- Emerging: Countries who have bonds that are not considered "investment grade"
Market Capitalization
Definition: Market Capitalization is a measurement of business value based on share price and number of shares outstanding.
Coverage: Equities Only
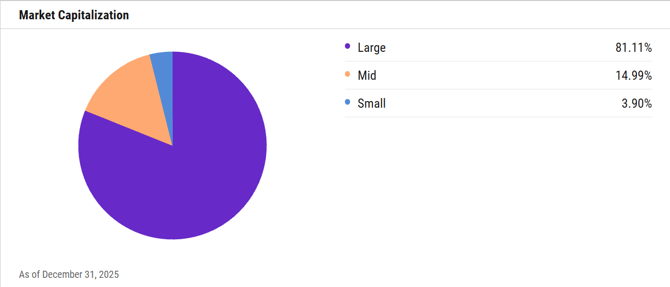
Breakdown:
- Large: Top 70%
- Mid: Next 20%
- Small: Bottom 10%
Stock Sector Exposure
Definition: Stock sector exposure will show the breakdown of a fund or portfolio's long equity assets across eleven major industry groups and how they roll up to three broad sectors - cyclical, sensitive and defensive. We will categorize securities by their GICS sector classification.
Coverage: Equities Only
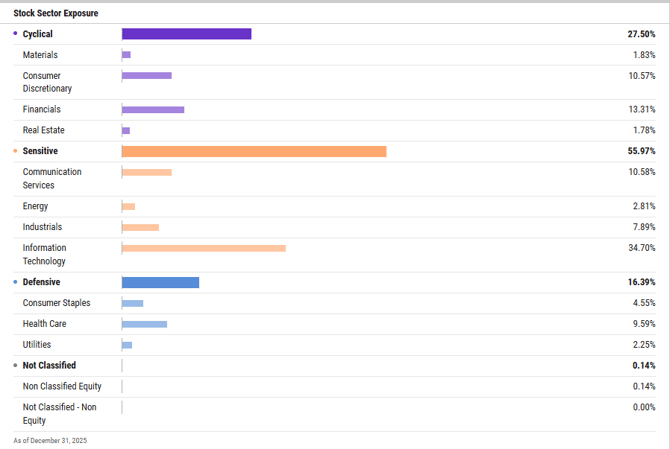
Breakdown:
- Cyclical: Industries that can be significantly impacted by economic shifts.
- Materials, Consumer Discretionary, Financials, and Real Estate
- Sensitive: Industries that tend to move with the overall economy, but not in a significant way.
- Communication Services, Energy, Industrials, and Information Technology
- Defensive: Industries that are less sensitive to economic cycles.
- Consumer Staples, Health Care, and Utilities
Stock Style Exposure
Definition: Stock Style Exposure shows how a portfolio's holdings are distributed across companies of different sizes (based on their market capitalization) and investment styles (value, blend or growth).
Coverage: Equities Only
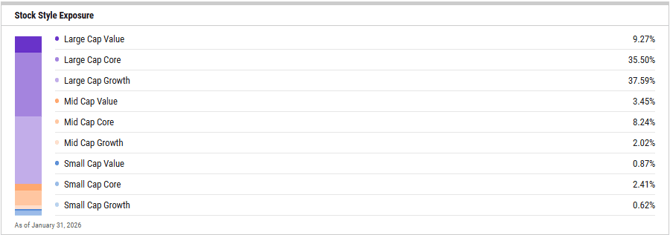
Breakdown:
- Market Cap Thresholds:
- Large: > 75 billion
- Mid: 25 billion - 75 billion
- Small: < 25 billion
- Stock Style Thresholds:
- Z-Score:
- Price-to Book (3Y Mean)
- Price-to-Sales (3Y Mean)
- Price-to-Earnings (3Y Mean)
- Return on Equity (3Y Mean)
- Revenue (3Y Growth)
- Dividend Yield
- Z-Score Thresholds:
- Z-Score > 0.3 = Growth
- Z-Score < -0.3 = Value
- Z-Score between -0.3 and 0.3 = Core
- Z-Score:
Common Questions:
Bond Sector Exposure
Definition: Bond sector exposure shows the percentage of a portfolio’s long fixed income assets invested in given sectors.
Coverage: Fixed Income Only
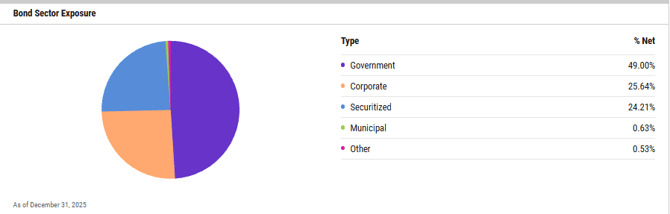
Breakdown:
- Government: government bonds, such as treasury securities, and other debt securities issued by national governments
- Corporate: bonds issued by corporations, such as corporate debt securities.
- Securitized: mortgage-backed securities (MBS), asset-backed securities (ABS), and other types of securitized debt.
- Municipal: bonds issued by local governments, such as municipal bonds, and other debt securities issued by state and local authorities.
- Other: other types of bonds, such as international bonds, supranational bonds, and other debt securities that do not fit into the above categories.
Bond Credit Quality Exposure
Definition: Credit quality exposure metrics show the breakdown of a fund or portfolio's fixed income securities across various credit rating categories
Coverage: Fixed Income Only
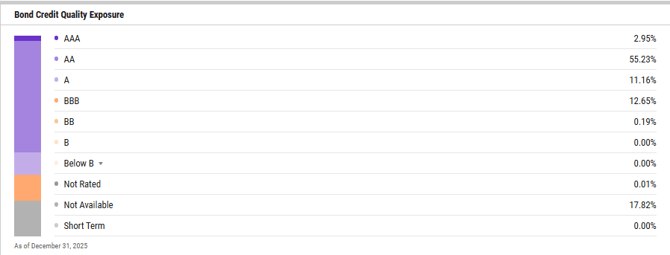
Breakdown:
Each rating agency uses its own alphabetical scale, typically ranging from high (AAA to AA), to medium (A to BBB), and low (BB, B, CCC, CC, C, and D). Investment-grade bonds generally carry ratings of AAA, AA, A, or BBB, while non-investment-grade (high-yield or junk) bonds are lower credit quality and higher risk due to a greater likelihood of issuer default.
YCharts receives fund-level credit quality exposure from a third-party provider. Percentages for each rating category are calculated by weighting each holding’s credit rating by its market value and averaging over the total value of holdings. For securities with multiple ratings, an average rating is used. Distributions are based on available ratings from recognized credit rating agencies, such as Nationally Recognized Statistical Rating Organizations (NRSROs) in the U.S.
Bond Maturity Exposure
Definition: Bond Maturity Exposure provides a breakdown of the fixed income securities held within a portfolio based on their bond maturity dates.
Coverage: Fixed Income Only
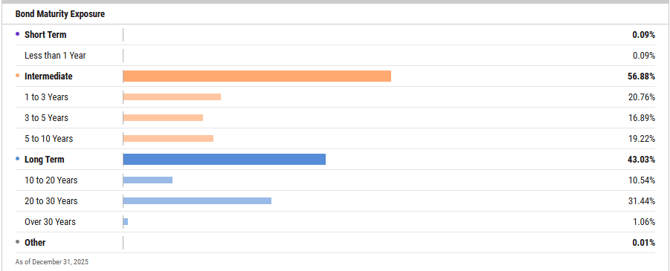
Breakdown:
Fixed income securities are grouped into three categories - short-term, intermediate-term, and long-term maturities. Short-term bonds generally have maturities of one to three years, intermediate-term bonds range from four to ten years, and long-term bonds have maturities beyond ten years.