The Chart Options in Fundamental Charts provides additional customizations, from custom colors, adding recessions and adjusting the scale and view of the chart.
Show Annualized Data
Show Custom Colors
Show Forward Estimates
Show Legend Above the Chart
Show US Recessions
Use Log Scale
Show Annualized Data
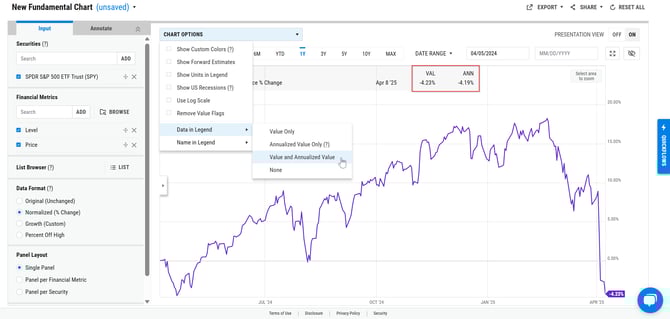
Our annualized data option allows you to see the annualized growth rate of the metric based on the start and end date of your fundamental chart. To view this data, follow the steps below.
- Click Chart Options --> Data in Legend
- Select Annualized Value Only or Value and Annualized Value
- Annualized data will appear in the legend
Want to see annualized data in all of your charts? Make this a default setting.
- Reset your chart so no securities or metrics are attached
- Click Chart Options --> Data in Legend
- Select one of the options
- Click on 'New Fundamental Chart' in upper left corner
- Select 'Set as Default'
Show Custom Colors
Using Custom Colors is a way to personalize your charts, which can enhance the cohesiveness of your materials.
Follow the steps below to turn this feature on for your charts.
- Click Chart Options
- Select Show Custom Colors

Want Custom Colors to automatically appear in all of your charts? Make this a default setting.
- Reset your chart so no securities or metrics are attached
- Click Chart Options --> Show Custom Colors
- Click on 'New Fundamental Chart' in upper left corner
- Select 'Set as Default'
Do you need to set or modify your custom colors? Click your name in the top right corner of YCharts to head to your Account Settings here.
Show Forward Estimates
Display forward estimates for selected metrics, such as EPS Diluted. Forward estimates will appear on the chart as a dotted line. To view this data, follow the steps below.
- Click Chart Options
- Select 'Show Forward Estimate

Show Legend Above the Chart
If the legend of your chart obstructs the data displayed, you have the option to remove it from the chart and position it directly above. To view this data, follow the steps below.
- Toggle to Presentation View
- Select Chart Options
- Uncheck 'Show Legend in Chart'

Show US Recessions
Including recessions in your chart can reveal how your security performed historically and provide insights into its potential performance during future recessions.
- Click Chart Options
- Select Show US Recessions
- US Recessions will appear as gray lines on chart

What criteria do we use to identify a recession?
We define our recessionary periods using data from the National Bureau of Economic Research. Click here to find out more about their methods for determining recessions.
Use Log Scale
Our Log Scale option allows you to adjust the scale of the fundamental chart. To view this format, follow the steps below.
1. Click Chart Options

2. Select Use Log Scale
