Discover how the YCharts Dashboard helps you save time and enhance client communication by centralizing securities and economic data in one place. Easily customize visuals, metrics, and data points for quick insights, and seamlessly share dashboards across your team.
How to Create a Dashboard:
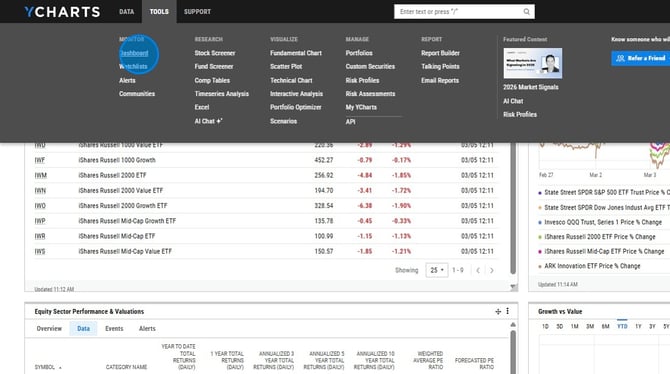
1. Select YCharts at the top left to navigate to the dashboard
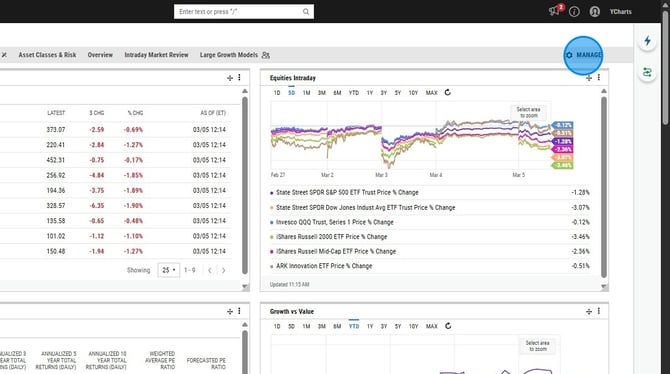
2. Select Manage at the top right
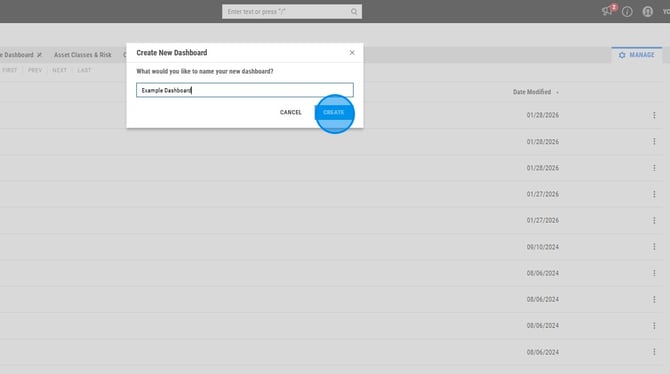
3. Select New Dashboard on the left side
.png?width=670&height=375&name=Create%20A%20New%20Dashboard%20And%20Add%20A%20Security%20List%20-%20Step%203%20(1).png)
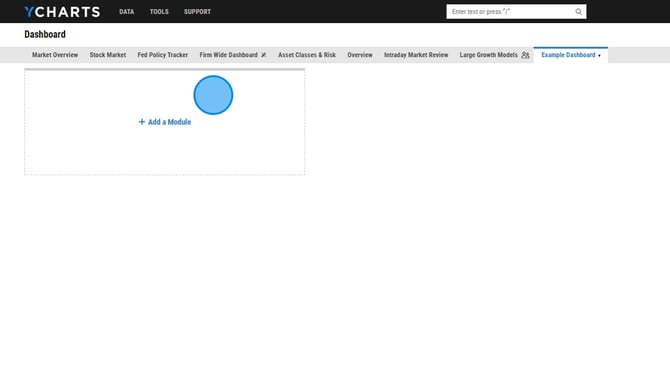
4. Give the new dashboard a title
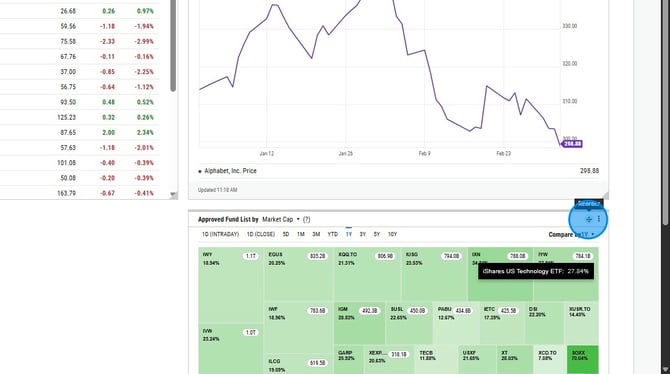
5. Select Add Module to add modules to the dashboard
6. Resize the modules using by dragging the bottom right corner
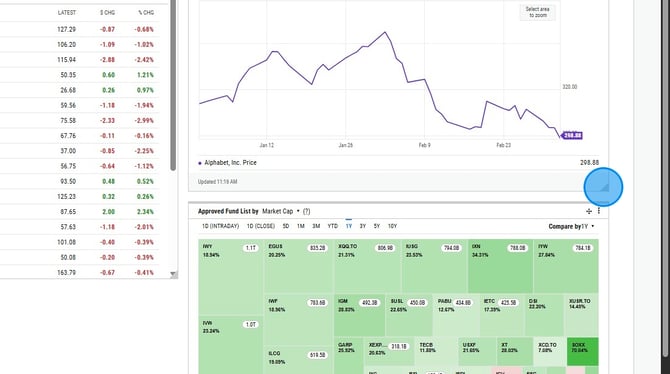
7. Reorder the modules using the arrow icon at the top right of the module