Learn how to use the Dashboard tool to monitor client portfolios and market data in one centralized view, customize modules like watchlists and charts, and set up alerts to stay informed on key changes.
How to add a Dashboard Ribbon for Monitoring
How to add a Charts to Dashboard for Monitoring
How to Monitor Key Positions and Market Indices on the Dashboard
How to add a Dashboard Ribbon for Monitoring
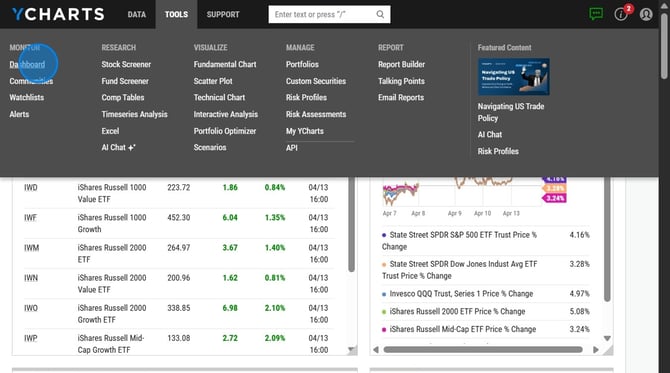
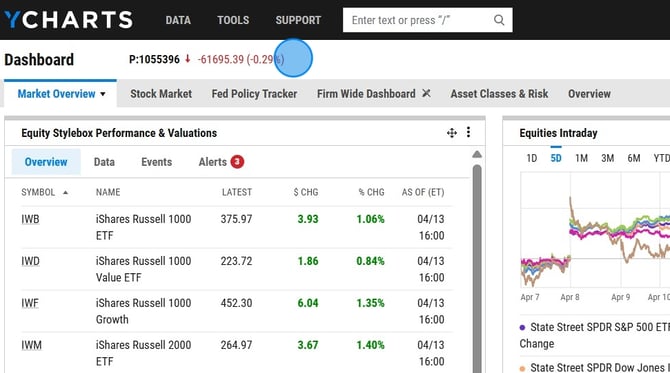
1. Navigate to the Dashboards under the Tools tab.
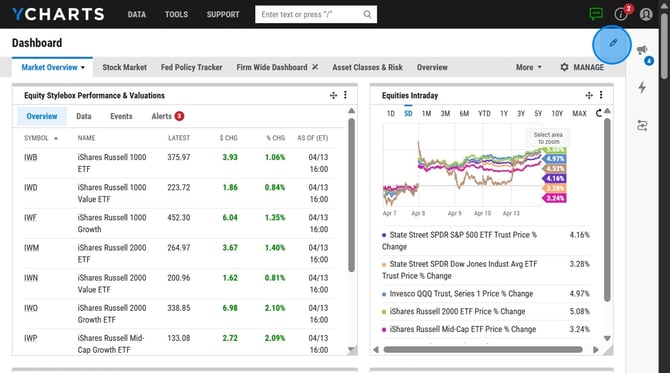
2. Select the pencil icon in the top ribbon to add client portfolios, indices, ETFs, or other tickers you want to track.
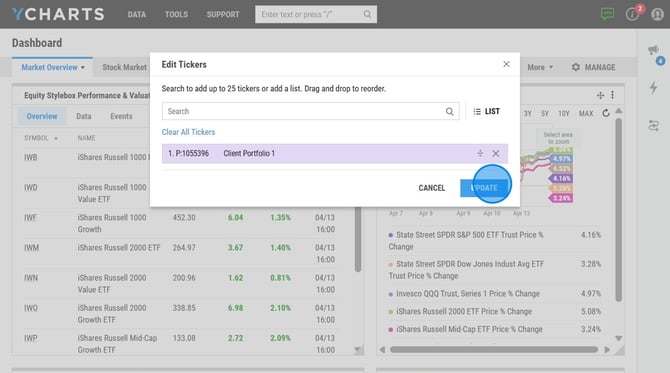
3. Search for your Watchlist, Portfolio or security and select 'Update'
4. Use the ribbon to quickly scan key securities, which update throughout the day with intraday data, and hover over any ticker to pause and review its details.
How to add Charts to Dashboard for Monitoring
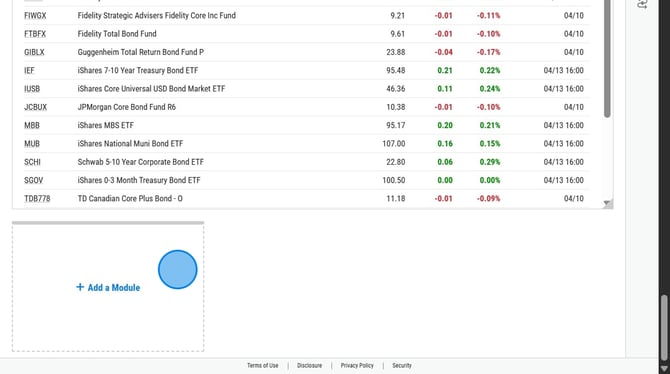
1. Add chart modules to your dashboard to track client holdings and broader market trends by selecting “Add Module”
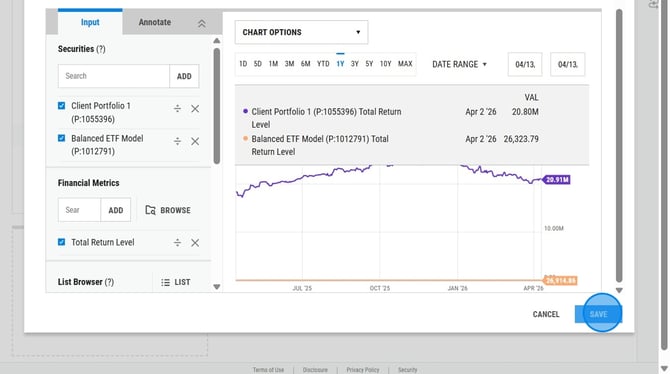
2. Enter your model or security and Financial Metrics and then select 'Save'
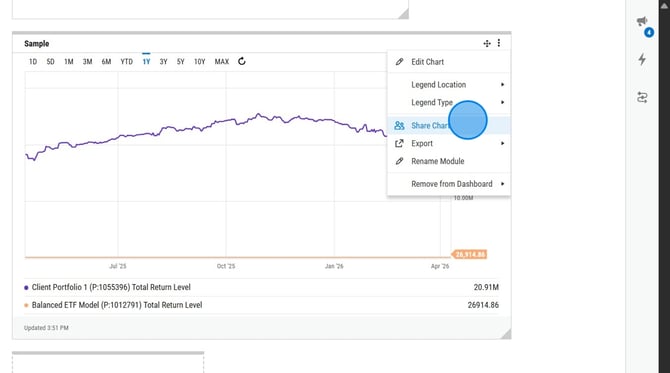
3. Use the three-dot menu on any module to share it with colleagues, choosing whether they can view or edit the content.