CASE STUDY


About
North Star Investment Management is a multi-faceted firm providing investment management, financial planning, and mutual fund management, among a host of other services. Eric and Brooke Kuby are a father-daughter research team that work closely together on the firm’s two small-cap strategies, the North Star Micro Cap Fund (NSMVX) and the North Star Dividend Fund (NSDVX).
Eric Kuby has over 37 years of experience serving both individual and institutional clients. As Chairman of the Investment Committee, Eric oversees the firm’s various investment strategies and acts as portfolio manager for the firm’s various publicly traded funds. Eric holds an M.B.A. in Finance as well as a B.A. in Economics from The University of Chicago.
Brooke Kuby works across the North Star Fund Family in several functional areas including Equity Research and Marketing. She received her Bachelor of Science in Business Administration from the University of Southern California.
![]()
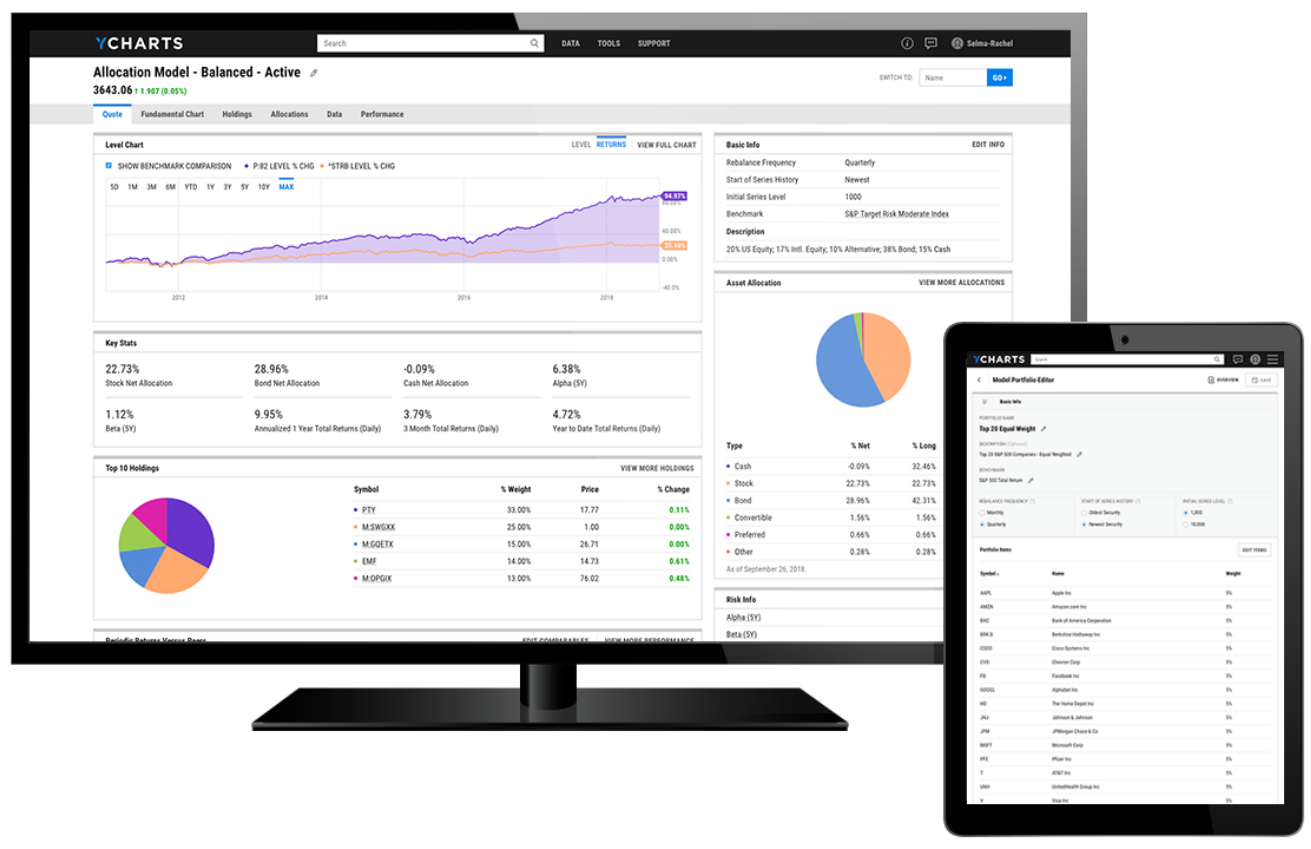
Bloomberg is like a Ferrari, but they don’t ever show you how to drive it. Some things worked well, but it was hard to use if you weren’t already an expert...With YCharts, it’s easy to look at a chart and understand immediately what you’re looking at.”

![]()
YCharts helped consolidate all of the information we needed in one place, so that we
could seamlessly jump from researching a security to analyzing a portfolio’s performance.


Success Made With YCharts
North Star Investment Management Corp leverages YCharts to optimize its investment research, create visually appealing and easy-to-understand client materials, and streamline firm-wide workflows.