CASE STUDY


About
Meet Brad Rathe, AIF®, and David Keller of StrategIQ Financial Group. Brad has over 25 years of experience in the financial services industry and has served as StrategIQ Financial Group’s Chief Investment Officer since 2012. He manages a team of 20+ researchers and analysts and focuses on macro-level research where he takes an objective, quantitative approach to making investment decisions for his clients. David is one of StrategIQ’s financial analysts and traders, and assists Brad with sector and equity research, generating new investment ideas, and building out client portfolio strategies.
![]()
I needed a tool that allowed me to write my own code for databasing purposes, but also one that would be easy-to-use, but, more importantly, easy to learn so my team could get up and running as quickly as possible.
![]()
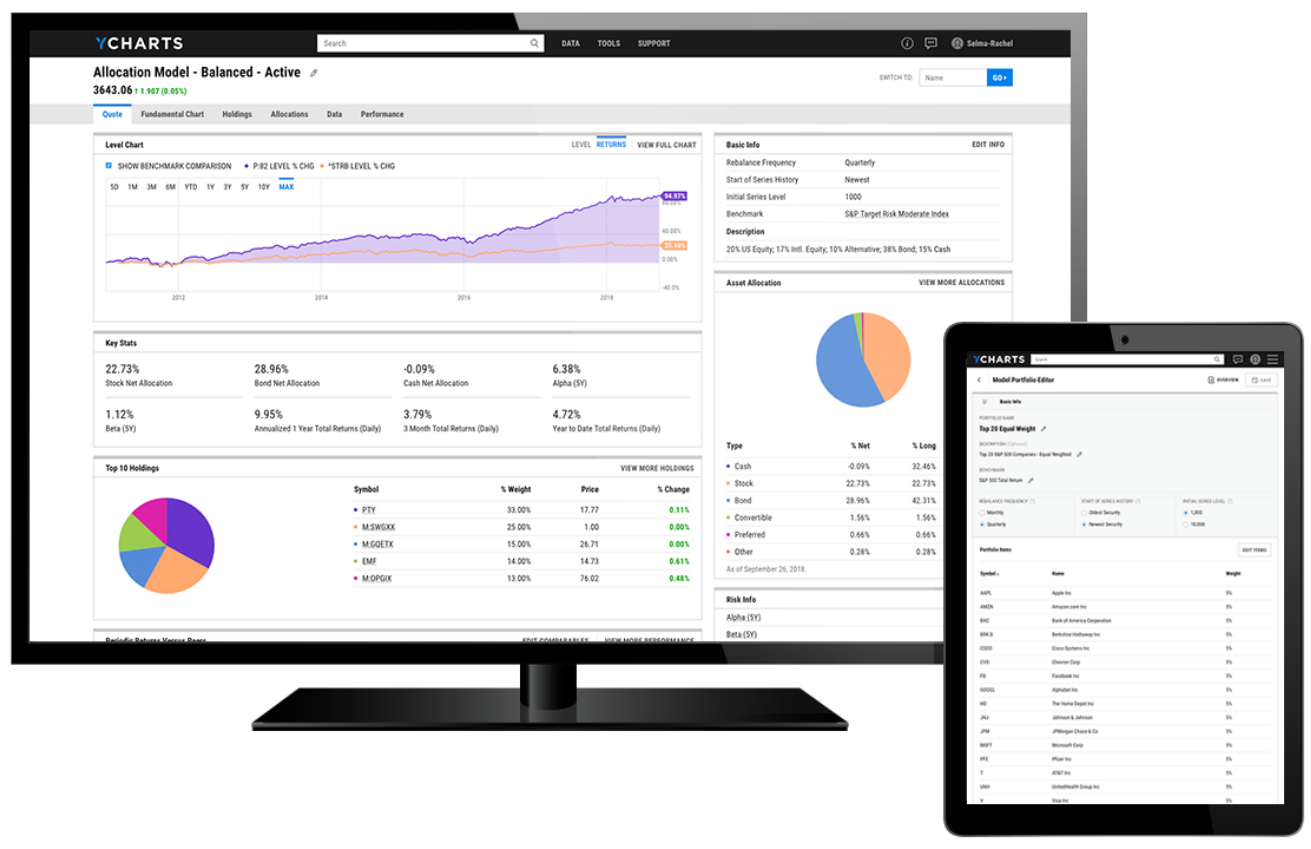
YCharts has built an investment research platform with advisors in mind. The platform is lean and mean, creating tools with the highest impact to provide the most value to their customers.
![]()
Simplifying the complex and nailing the ease-of-use is what YCharts does best. The platform’s interface and accessibility are top tier and really simplifies finding the data without substituting the breadth or scale of the information needed.


Success Made With YCharts
Bradley Rathe, CIO, and David Keller, Financial Analyst/Trader, at StrategIQ Financial Group, LLC rely on YCharts to perform comprehensive investment research, generate new investment ideas, and streamline their portfolio construction and analyses to better educate and serve their clients.