CASE STUDY

ycharts case study logo

Valley Wealth Group Finds Its All-in-One Solution for Fund Screening & Portfolio Analysis

George Wootten Headshot - 400 x 400
About

George Wootten, AIF® is an investment analyst at Valley Wealth Group, an LPL-partnered RIA firm. With the goal of providing top-tier investment strategies and financial planning for their clients, George and his team develop investment models based on their clients’ risk tolerance and preferences. Valley Wealth Group prides itself on understanding its clients and their unique set of circumstances to help them make the best decisions possible and pursue their financial aspirations.

The Challenge

In 2017, Valley Wealth Group started to implement firm-wide models as a way to better serve their clients and also spur AUM growth. As George and his team evolved, they needed an investment research platform that could keep up.

“Our previous data provider was lacking and didn’t provide as granular information as we needed,” says George. “We couldn’t pull in daily or weekly data easily and would manually record NAV fund closing prices. 

The process was tedious and would take me days to log all those periods of returns whenever we rebalanced our models.”

Having previously used multiple research platforms concurrently to perform his day-to-day tasks, including Zacks and even a Bloomberg Terminal, George was looking for a “one-stop-shop solution that would deliver on all fronts.”

Untitled design (16) copy
We couldn’t pull in daily or weekly data easily and would manually record NAV fund closing prices. The process was tedious and would take me days to log all those periods of returns whenever we rebalanced our models.

The Solution

After exploring YCharts via a free trial, George was sold on it being the platform that could not only streamline his workflows and grow his business, but also provide additional value to clients.

One of the key differentiators that George noticed about YCharts was its ability to visually illustrate any security’s financial narrative.

“The data presentation capabilities were a big reason why I decided to switch to YCharts,” says George. “There’s no other platform that I’ve seen that can present and provide information as neatly while allowing users the ability to tweak and mold it the way YCharts can.”


Model Portfolio - Data Tabs


Start a free trial


“I’ve worked with a Bloomberg Terminal previously, but the overall user experience was very clunky and not intuitive at all,” says George. “YCharts’ data is not only comprehensive but pulling in data feels automatic. Any rebalancing tasks or recurring tasks are now seamless and streamlined. It’s the most comprehensive research tool that I’ve used to date.”

“The YCharts customer support team has not only educated me on new datasets and financial metrics I might’ve missed, but they’ve gone above 

and beyond to tailor my experience based on my firm’s use case.”

George further highlighted the team’s phenomenal support and ability to translate his firm’s needs. “Our previous service provider needed a lot of hand-holding and the process to answer any of my questions was always drawn out, but thankfully that hasn’t been the case with YCharts.”

Untitled design (16) copy
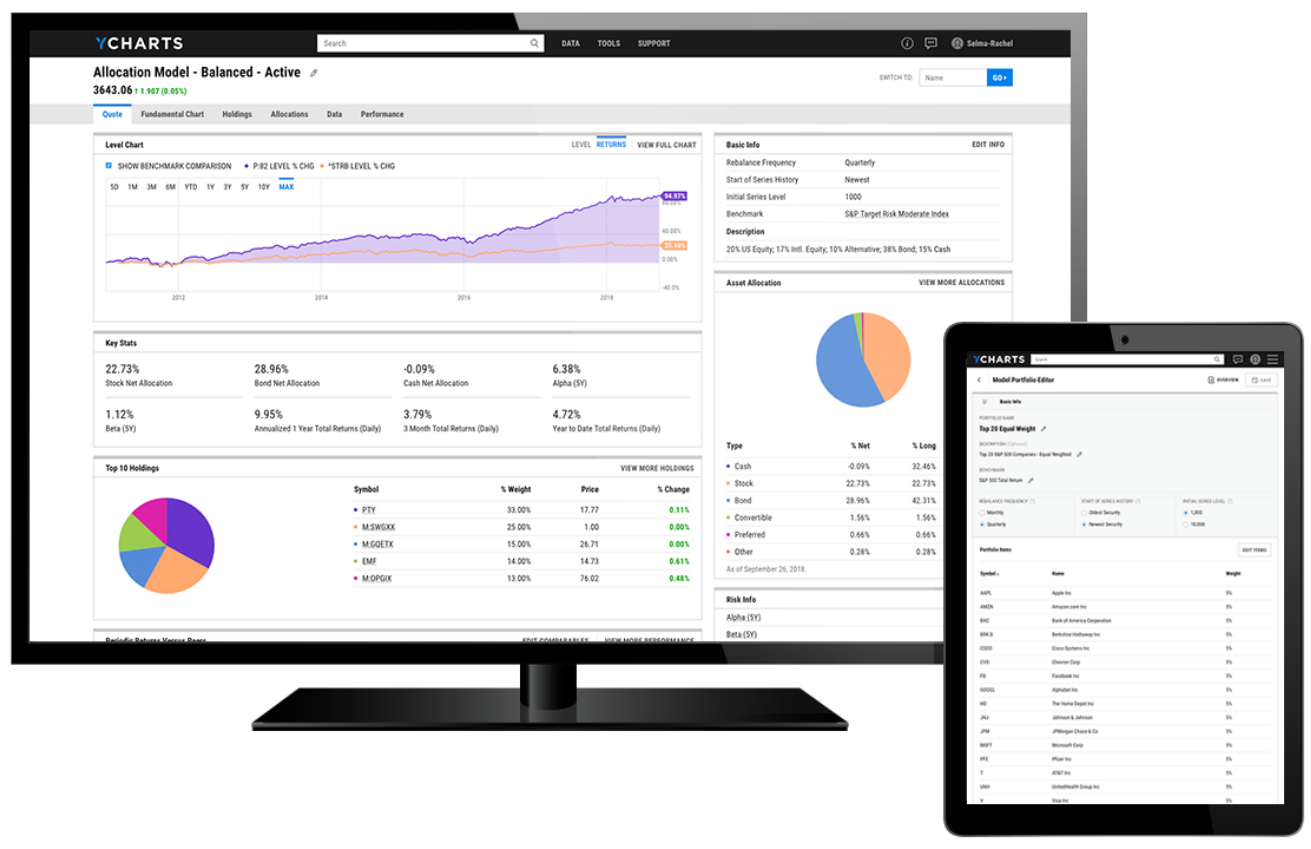
The data presentation capabilities were a big reason why I decided to switch to YCharts. There’s no other platform that I’ve seen that can present and provide information as neatly while allowing users the ability to tweak and mold it the way YCharts can.

The Results

With his time better optimized, George now has capacity to explore and leverage the wealth of data available within YCharts. “It’s just a matter of understanding which metrics and data matter the most to my team for making smarter decisions, and identifying the weakest and strongest funds. The data’s there, we just need to find it,” says George.

George will oftentimes start in the Fund Screener where he and his team will look at roughly 30 different asset classes and use a combination of

the 80 metrics they rely on when creating a new fund screen. The fact that Valley Wealth Group has fully migrated their research workflows to YCharts is a testament to how much they trust the platform’s capabilities to handle anything that’s thrown their way. George has since built out and saved over 60+ screens that he can easily reference and pull into Comp Tables, where he runs head-to-head comparisons of funds that passed his screening criteria.


Fund Screener - upside downside capture ratio


Start a free trial


As part of the transition to YCharts, George replicated the 25+ models, sleeves, and proprietary benchmarks he uses daily into the tool using Model Portfolios. One of the features he consistently leverages is the distinct profile page that’s created for each model, similar to a typical securities quote page.

YCharts has found a permanent home in George’s browser with the tool always open and ready for him to use. He’s been able to save an average of 10 hours on quarterly rebalancing efforts and save 30 minutes or more per day when reviewing market trends.


Excel Template - Market Update


Start a free trial

“While I use Model Portfolios, Comp Tables, and the Fund Screener most often, I’m trying to get the most out of YCharts as a whole and have found a lot of value in the Excel Templates as well as Email Reports to stay up-to-date on performance for the market, models, and funds we track,” says George.

“There’s just so much unexplored data and functionality that I know I can find additional value from and build out my research & analysis even further.”

Untitled design (16) copy
While I use Model Portfolios, Comp Tables, and the Fund Screener most often, I’m trying to get the most out of YCharts as a whole and have found a lot of value in the Excel Templates as well as Email Reports…There’s just so much unexplored data and functionality that I know I can find additional value from and build out my research & analysis even further.


computer croped

Success Made With YCharts

George Wootten, AIF®, Investment Analyst at Valley Wealth Group, relies on YCharts to stay up-to-date on the latest market trends, perform quarterly portfolio rebalancing, and automate idea generation to streamline his fund research & analysis.

 
Free trial buttonbook a demo button


Disclosure: YCharts, Valley Wealth Group, and LPL Financial are separate entities. Securities and advisory services offered through LPL Financial, a registered investment advisor, Member FINRA/SIPC.