CASE STUDY


About
Michael Minnoch has over 20 years of experience in the financial services industry. After launching various arms of the business focusing on financial planning, insurance, futures, and alternatives, he spun off some functions in 2017. He now focuses primarily on investment management and commodities through Vantage Point Management, Inc. (“VPM”) and Vantage Point Alternatives (“VPA”), a CTA. As VPM’s Money Manager, he is responsible for selecting securities, performing technical analysis, and managing portfolio strategies to ensure they are consistent with a client’s objectives and risk profile. In addition to managing investments on behalf of his partner financial advisors, Mike also works with a small number of his own clients.
The Challenge
Serving over 300 advisor clients, Vantage Point Management provides tailored model portfolios, including white-label models, as an outsourced investment manager.
Previous services that Mike relied on to create his investment models were not up to par and simply did not deliver in terms of user experience.
As an Excel super-user with a strong focus on fundamental data, he wanted a platform with the horsepower to build advanced models, but also automation to free himself from manual data entry and other limitations. In short, Mike needed to streamline his team’s portfolio construction process.
![]()
There’s not a ton of options out there that can compete with what YCharts offers, especially the comprehensive data on the platform and its Excel integration capabilities.
The Solution
Mike had previously utilized FastTrack to create model portfolios and built presentation reports manually in Excel, but found the reports and platform weren’t as comprehensive or user friendly as he needed.
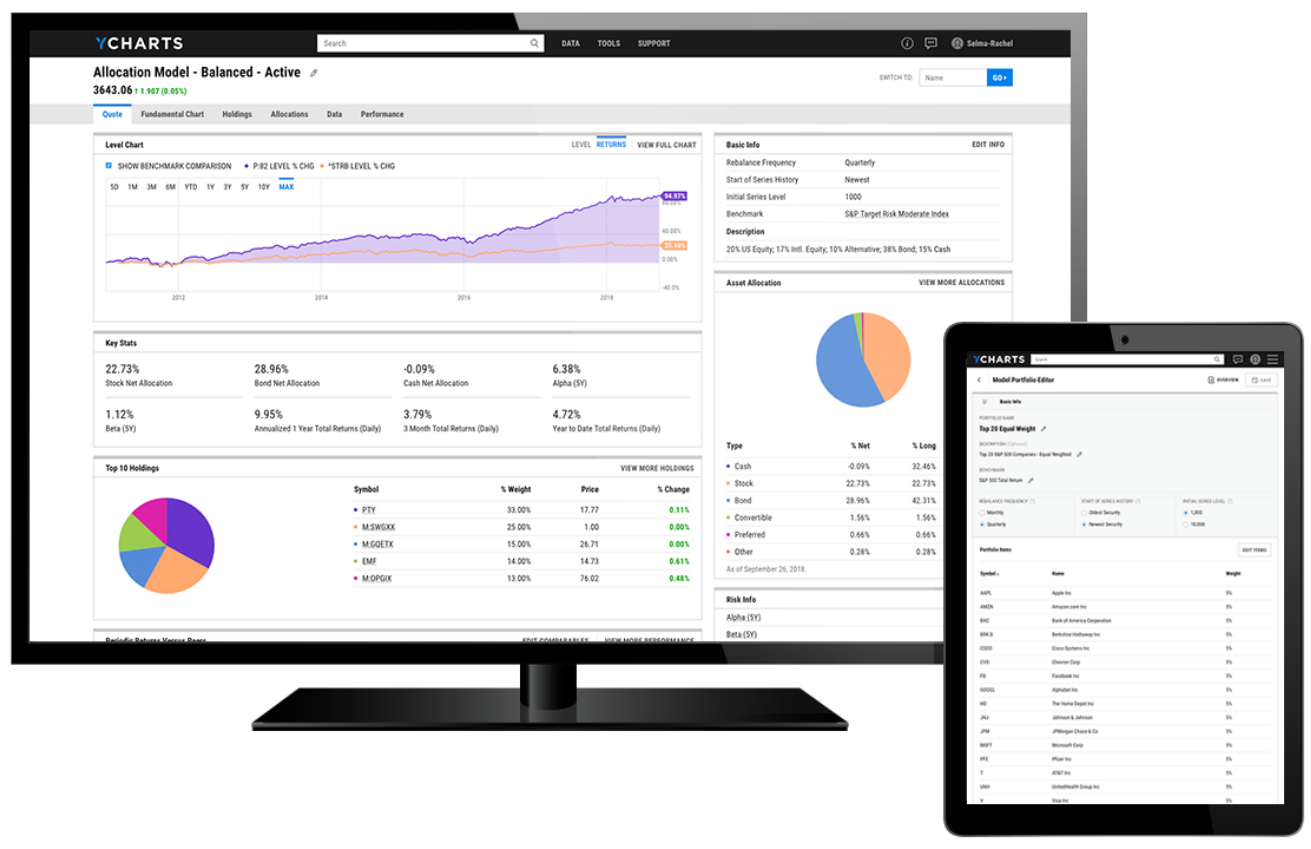
With the YCharts Excel Add-In, he can easily run analyses in Excel, seamlessly create templated factsheets to share with advisors, and generate client-friendly portfolio reports that he and advisor partners leverage. YCharts’ comprehensive datasets and tools to manipulate the information for his needs were a game-changer. Mike now had full control over his model strategies and an efficient means for educating other advisors on their merits, which was crucial in his decision to switch to YCharts.
“The only other competitor out there is Bloomberg, but it’s no question to me. I’m not actively looking for real-time data with my finger on the button, so the cost differential and the value that YCharts brings is a no-brainer,” says Mike. He’s found additional value from YCharts’ customer support team, noting their proactive outreach as more and more tools are added to the platform. Whether updating him on the newest features or suggesting workflows based on his specific use cases, the YCharts Support team has helped optimize his process, working with him as an extension of his team.
![]()
The only other competitor out there is Bloomberg, but it’s no question to me. I’m not actively looking for real-time data with my finger on the button, so the cost differential and the value that YCharts brings is a no-brainer.
The Results
With YCharts’ launch of Dynamic Model Portfolios and FINRA-reviewed portfolio reports, Mike has built on his success by further streamlining his portfolio construction and reporting processes.
For Mike and his team, building a portfolio comparison no longer requires manual data entry in Excel. “Give me the holdings and percentages, and I can create a portfolio in a pinch with YCharts.” On top of that, he’s replaced his templated factsheet in favor of YCharts’ Side-bySide Comparison Reports, generated within seconds, to provide his clients a comprehensive understanding of their original strategy versus VPM portfolios.
"It takes me just ten minutes after receiving an advisor’s holdings to put them in Model Portfolios, review, and send over a complete report output. After that, all they have to do is go and win the business. It doesn’t get much better than that.”
Mike remembers “an advisor-partner who had an appointment at 9:30 once gave me the prospect’s holdings at 9:00. By 9:10 I had already sent the report back to the advisor for them to review. They came up with their pitch and went on to win the prospect’s business.”
Mike estimates that it takes him just 1 hour to update and track each of the 40 models he
manages. Before YCharts, he was “working 12 hour days to perform the number crunching and technical analysis alone.” As Mike likes to put it, “YCharts has provided me time, freedom, and potential”, which allows him more personal time, but also more time to maintain and build his client base. “The more I’m out there, the more I’m meeting advisors, the more I’m driving VPM’s growth. At the end of the day, it’s a relationship business, not a numbers-crunching business.”
Vantage Point Management was an early adopter of YCharts, and Mike has seen the platform evolve alongside his own business, growing VPM’s assets under association by 500%.
With the additional free time, Mike can explore client ideas for new portfolio strategies using YCharts and tailor them to a client’s investment and risk preferences. Whether they’re based on what’s trending or grounded in prior experience, the ability to anchor an idea to fundamental data and objective performance results ensure a non-bias approach.
“YCharts continues to evolve with advisors and what they need. I can tell that YCharts does their research before developing a new feature,” says Mike. “Keep innovating! Continue to innovate and answer the biggest questions advisors face daily.”
![]()
It takes me just ten minutes after receiving an advisor’s holdings to put them in Model Portfolios, review, and send over a complete report output. After that, all they have to do is go and win the business. It doesn’t get much better than that.

Success Made With YCharts
Michael Minnoch, Owner & Money Manager at Vantage Point Management, Inc., leverages YCharts to arm advisor-partners with compelling portfolio comparisons, integrate his Excel-based models with live datasets, and build tailored model portfolios for his clients.


