CASE STUDY

About
With the widespread market downturn at the start of the COVID-19 pandemic, Zel Abdu dove headfirst into his new career as a full-time investor. Prior to this switch, he worked in the oil and gas industry, but never had the opportunity to take full advantage of his finance degree. Having a lifelong passion for finance and investing, Zel decided to make the most of the market opportunity and pivoted his career. Since that decision, he’s quickly built up his investment knowledge with eyes on both long-term asset growth and some short-term profits from trading.
![]()
Every day I was learning something new, but I realized that I could be performing better if I optimized my process… I needed a tool that had all the information I wanted in one place, so I could easily apply my learnings and make better investment decisions.
![]()
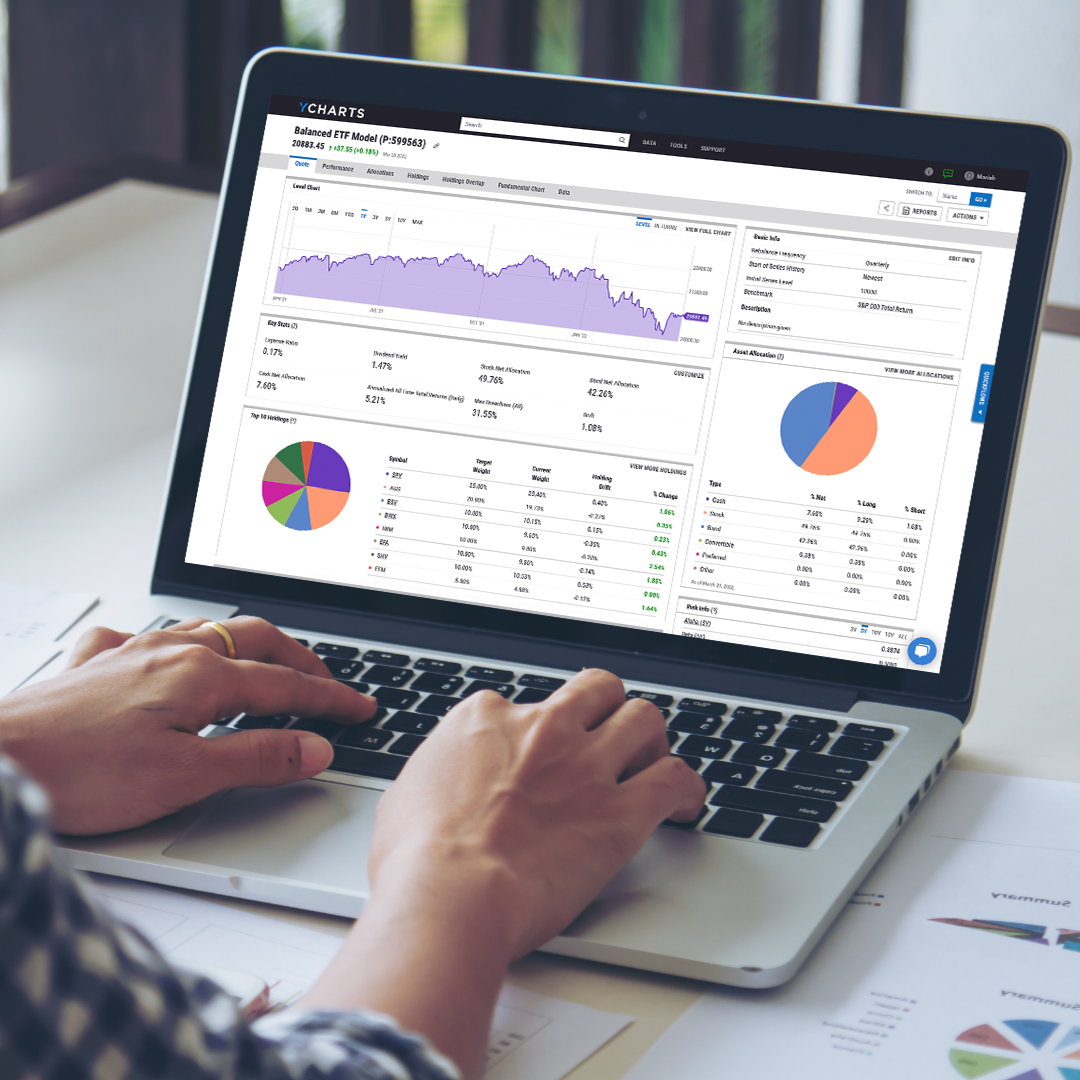
The first time I used YCharts, it reminded me of Google with the search bar always available. It helped me find what I needed easily and focus on the information I was interested in without any distractions.
![]()
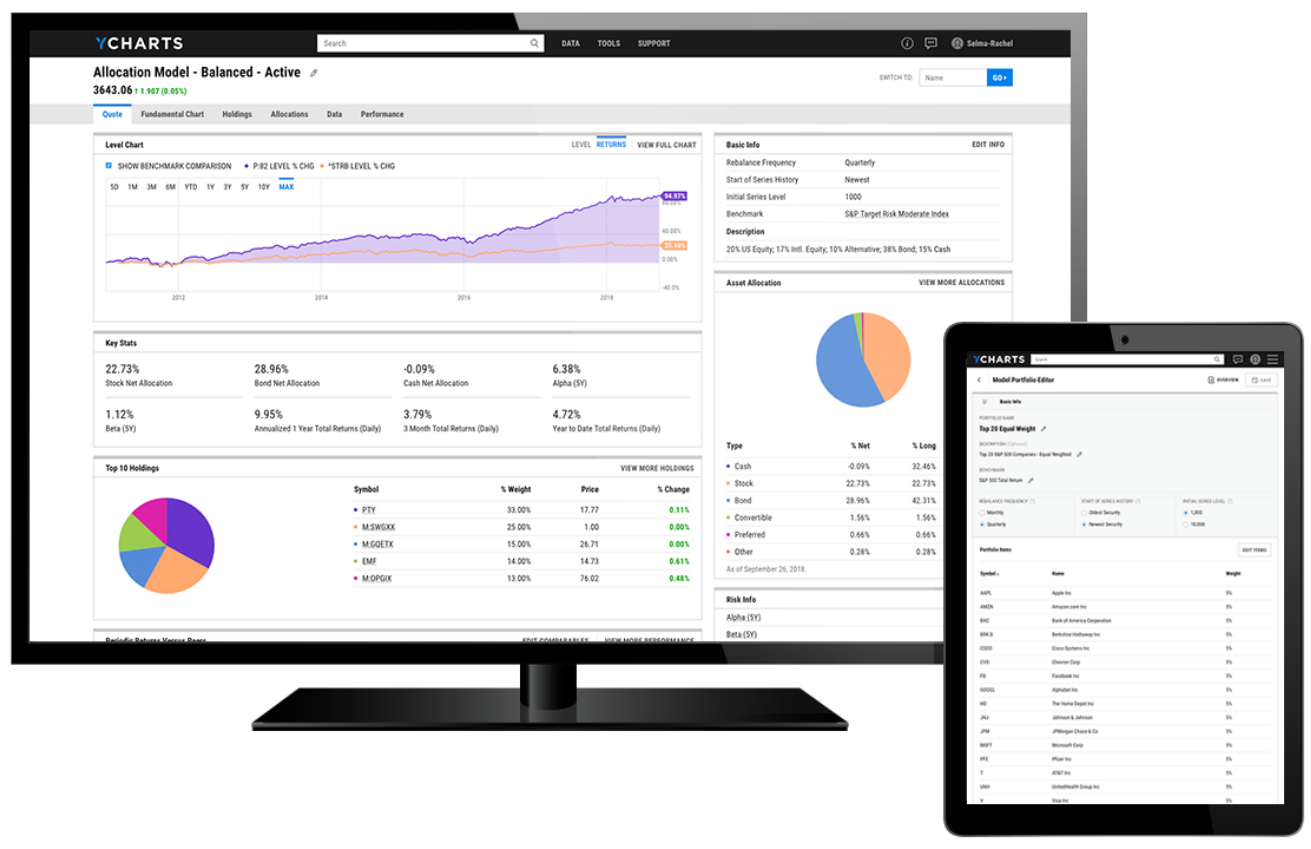
YCharts enables me to complete tasks in a couple of hours which used to take me days. I’m researching twenty companies in depth each day when I used to only do three. Now I use that extra time to continue learning and improve my process.


Success Made With YCharts
Zel Abdu is an individual investor who uses YCharts to perform in-depth, efficient research and analysis for stocks and provides him a platform to build on his investment and financial knowledge.